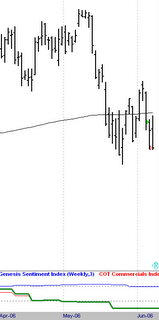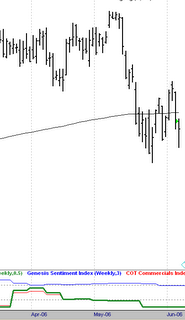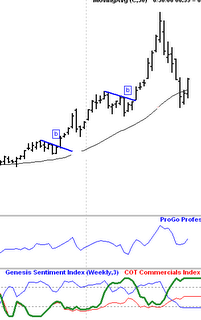
This chart is posted for you Lisa, but may be of value to others as well. This is a weekly Comex Gold chart, with 2 "bull flags" marked. This is an age old technique for buying pullbacks in an uptrend. What you do is basically wait for a pause in the action, that visually looks like a flag. The blue lines, mark the top of the flags. Basically, you wait for a breakout above the flag (blue line), to enter a postion, in sync with the underlying trend.
This GOLD chart provided 2 very nice such entries this year. Notice, how the most recent drop from the high, never broke out above any flag line that you would draw. Waiting for this breakout, saves you from blindly catching a falling knife, like what we have had recently.
Notice, the difference just in simple terms, for how the more recent pattern looks, compared to the prior two. The best flags setup, look like the first two. This is a very low risk way to trade trending markets. The trades can last anywhere from a week to a month or two, depending on how you manage them.
There was a time, when I traded only this pattern, many years ago. I just went to the markets, whatever it was from Oil to Corn, to bonds, looking for this pattern. When I saw it, I just played it. It is a profitabe approach to trading, in general.
Trends only go on for so long, so the flags that setup later in the trends are higher risk. This trend has been in place for awhile in this market. Low and behold, you get a nasty pullback, like what we have had recently.
DISCLAIMER
PLEASE READ THE DISCLAIMER AT THE BOTTOM OF THIS PAGE WHICH APPLIES TO ALL CONTENT IN THIS BLOG AS WELL AS ANY OTHER MATERIAL FROM WE ARE FUTURES TRADERS LLC. READING ANY CONTENT BELOW CONSTITUTES AN AGREEMENT BY ALL READERS THAT THEY HAVE READ AND AGREE TO ALL THAT IS SET FORTH IN THE DISCLAIMER AT THE BOTTOM OF THIS PAGE.
Friday, June 30, 2006
Wednesday, June 28, 2006
Housing Futures
To the left, is a chart of the local LA housing futures contract. If you look to the bottom of it, you can see the volume is very low. In general, I do not watch volume, as it is not of any value in trading. However, it is important to trade in markets that have sufficient volume, to get good executions on your orders.
The reason that this is important is as follows. When orders are placed, there has to be someone who essentially, has the opposite view of where price is going. This is necessary, because someone has to buy when you sell, and sell when you buy. Otherwise, the orders will just sit in the pits, with no executions. Most futures markets, have more than enough participation, to not worry about this.
This market at the current time, does not. Notice, the jumps from dot to dot on the initial trading days. This is the only price, that any trades were executed. In a situation like this, you can actually be correct about the direction of the market, yet not be able to get out at the right time. The success of this market is hinged upon larger participation. At some point, hopefully, the homebuilders will enter this market as a hedge, and create alot of liquidity.
We will know if this is happening, by a volume surge. Until then, stay clear of this.
Monday, June 26, 2006
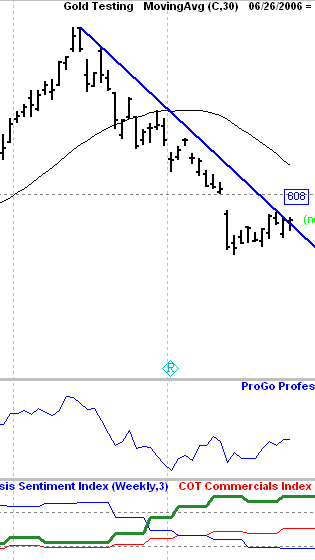
Here is the update Gold chart.
608 remains the key level, as it represents a fill of the gap on the chart. It is marked horizontally with the dotted line.
Until this is exceeded, this has to be viewed as a continuation pattern downward. Keep in mind the commercials, are long, so this may happen. If they were short, on this type of pattern, this would be a short entry setup.
Since, it is a continuation down pattern, with bullish fundamentals, it is a mixed signal setup, and hence no action at this time.
Sunday, June 25, 2006
US Dollar
I spoke of a possible rally that could occur in the Dollar recently in both my newsletter, and this blog. As you can see, this has taken place. When you enlarge the chart, you can see that the commercials were long this market. This served as a nice alert, to this price move.
The weekly chart, is somewhat flat at this point. As a result, do not get too excited yet about this rally. However, the insiders so far are behind it, so it could have legs from here. Time will tell on that.
There are many ways of trading these types of setups, which I am not going to discuss in great detail in this blog. My intent, is just to give some broad concepts here for review, and discussion, by any viewers.
Anyone long, should have their stop at breakeven at this point. Any logical entries, are well in the black at this point. Proper money management calls for break even stops at worst, once this type of gain is at hand.
Thursday, June 22, 2006
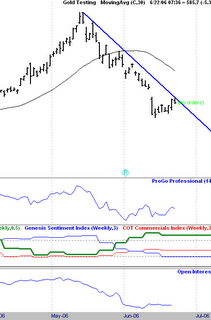
Here is the Daily Gold chart as promised yesterday
The first thing to notice, is how different this is from the weekly chart. There is a well defined downtrend in place. This is no secret, as the price has dropped from a high of 725 to a low of 561. The overall hierarchy of trading dictates that the larger time frame chart (weekly) should take precedence over the shorter (daily).
What this means is that we should take the larger term uptrend from the weekly, and try and time an entry in sync with the trend on that chart, on the shorter term daily chart. This is easy, when both of them have the same trend. When, they each have different trends, like this it becomes more of a challenge.
You can always choose the catch the falling knife in this situation, and hope the larger term time frame, does rule the day, and the price magically stops. I prefer to wait until there is confirmation that the drop has stalled. This at times will result, in buying at a higher price. It will also result at times, in dodging a major collapse.
Of course, dodging the major collapse, is the basic reason why this is prudent. I do not mind buying at a higher price, if I can sell at a higher price. The gap on the chart, which is just above where the price is currently trading, is the first level that must be exceeded. We have partially filled it so far, but often there is much overhead resistance in these gap areas. If you were just looking at the daily chart alone, this would simply be a bear flag selling setup into a gap. In general, those are decent setups to short a market.
Many discretionary traders I know, trade just these setups alone, claiming they are the holy grail. I would not go that far, but retracements in a trend are overall a profitable way to trade. Ideally, what we will get is a break of this daily downtrend. This would have both time frames both daily and weekly together. Then, wait for the first pullback in the daily uptrend. Once that occurs, play the retracements down against the new uptrend. This is the highest probability way of trading the market here.
If that does not develop, stay clear. There is the possibility price could continue lower here. The chart pattern, does have an eerily similar look to the 1980's top.
Wednesday, June 21, 2006
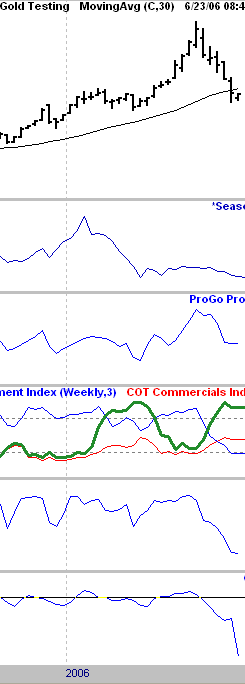
This is a weekly chart on GOLD
Notice from the bottom graph, the sharp decline in open interest on this drop. This is a very bullish indication. When this is combined with the net long position of the commercials, we do have s setup for a rally. We do have to wait until the end of the week for this chart to see what the readings will be.
If they stay at the same levels, we certainly have to be looking for a long side entry in this market. The next step, is to drop down to the daily chart which shows an entirely different story. I will cover that tommorrow. It is a matter of your time frame in trading or investing.
Mine is fairly short term, so I need both charts singing the same tune together, and they are not at the moment. I will cover tommorrow, what I will need to see on the shorter term daily chart, to get long this market.
Tuesday, June 20, 2006
Here is the update from yesterdays post
As you can see the short trade initiated on Friday's open, was exited this morning with a profit of 11.50 points. I had mentioned the tendency for yesterdays short term pattern, was for a decline. We did get that yesterday. I also had a day trade yesterday(not shown). That was initiated at 1254.50 on the short side, and exited at 1249, for 5 points profit. This trade was also based, on the same short term tendency for a decline.
When multiple indications of a move line up, all we can do is position ourselves in sync with it, and then let it play out. Fortunately, the historical tendencies worked out this time in my favor.
For today, I do not have anything that is high percentage, on a short term basis. When this happens, I do not trade PERIOD. We do have a trade on in my short term bond trading service. So I will follow that only for today.
Monday, June 19, 2006
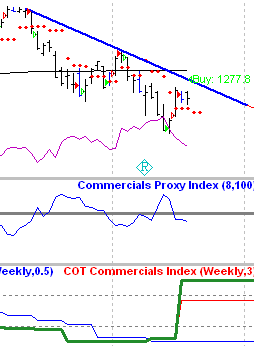
As you can see I currently have a short trade on in the S&P 500 futures. Most of my trading is pattern based. Friday's inside day with a down close, has in the last 10 years, been a bearish short term pattern. I was already in this specific trade prior to that inside bar being formed.
We will monitor this here to see if in fact, this tendency stays true. The very nature of short term trading is that we must accept a certain degree of random movement in pricing. All that can really be done, is hone in on what has created movement in the past.
Once we have done that, we make our decisions, with defined risk, and sit back and watch. Had today's opening been less than my entry on Friday, I would have exited the trade taking that profit. Since, it was above, I am riding this with the stop shown above at 1277.8.
Saturday, June 17, 2006
Here is the update daily S&P 500 chart
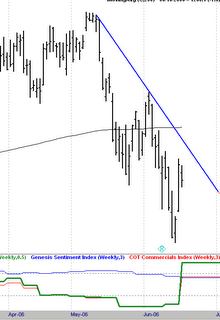
We are clearly in a downtrend at this point. The blue line is a basic trendline, just to mark that. Below, it can be seen that the commercials have gotten long this market.
As I have repeatedly told everyone, this does not mean run out and buy stocks. There is a seasonal down tendency into the fall from here. Also, the bond market has been in a down trend. These two things will act as a deterent to a rally from here.
However, with the commercial being long, we could see a bounce here. I think if it occurs, it will be a selling opportunity, for those who have not gotten out of the market yet. I still expect a big buy point to set up in the fall for stocks. There is no reason to get too excited about the long side yet, itleast until that trendline is broken.
This is the 10th instance in the month of June since 1985, that the commercials have been long. In 7 of the prior 9, the market went on to make a lower low in the fall, setting up the buy point. In the two exception years, where the market went straight up, the bond market was in a major uptrend at the time. The bond market is in a downtrend right now.
Thursday, June 15, 2006
Well - after yesterdays debacle, I have to confess that it was frustrating watching that losing trade play out. Especially, when I did have a winning trade setup on a shorter time frame that was passed due to what I explained. However, keep in mind that even with an 80% win rate that I have, 20% of the trades still lose. We cannot get too hung up on one bad trade. Part of being a successful trader, is learning from your losses.
As I had said in the earlier post, I would research the setup if a loss occurred to see what might be able to be improved next time. I did in fact find something significant, that had been overlooked. This particular pattern has been modified to incorporate this. Hopefully, I am getting some credit for being honest about losses when I take them. I find that many people do not do this. They lead people to believe that they just win on every trade.
The S&P 500 is a very volatile market, and one that is bound to hit you now and then.
Buy or Sell?
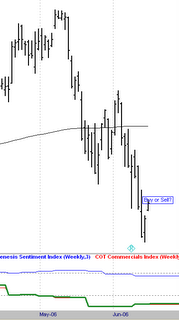
Enlarge this chart, and you can see that there is a very short term buy or sell decision to be made. I have short term signals telling me different things. How do you decide which way to go?
I think it needs to be mechanical. There is so much second guessing that can be done. I have done my share of it early in my trading career, and it can eat you up. Emotion is so closely tied to money, that we need to create as much separation between the two as we can.
A couple of simple rules. First, always defer to the highest time frame. In this case to the left, my buy signal is a day trade and my sell signal is an overnight hold. Therefore, by that rule, the sell wins.
Second, take the trade with the most favorable short term pattern. In this case, a gap open following the type of day we had yesterday, has in general been a better sell than a buy.
As a result, of those two simple rules, the sell trade was placed. Who knows if this individual decision will be correct. However, over a period of time, this type of logic will prevail. If it fails this time, I will research it heavily to see if there was something in the pattern at hand that I missed. If I find something, it will be put to use in the future.
For now, though, the decision is made, the trade is on, and I move onward to the next thing. No mental baggage. This is where systems trading helps separate the emotion from the decisions. Discretionary approaches have you going every which way, in situations like this. I would rather lose following strict rules, than stress out micro-analyzing every wiggle, and changing my mind every few minutes.
Wednesday, June 14, 2006
Buy Buy Buy - NO WAY!!!!
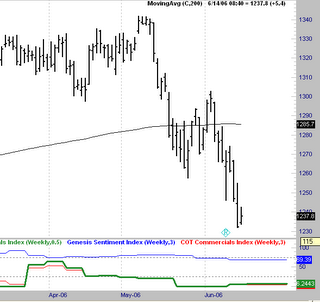
To the left is the updated S&P chart through early this morning. A couple of points. First, the widely covered 200 Moving Average displayed on the chart, has prove to be of no value once again. It is just a line on a page, having no statistical significance.
Second, the market is clearly in a downtrend. I had warned here on May 10th of the bearish setup in stocks. That feeling has not changed. As you can see below, the commercials are not buying this dip yet. As a result, there is no reason, during a bad seasonal time, to even consider getting long here.
The market is extremely oversold on a short term basis, having had 7 consecutive down closes. As a result, a bounce could occur at any time. All that will be is an opportunity to get out. I would not recommend any new long positions at this time.
Tuesday, June 13, 2006
Gold Implosion
As I had warned previously, the commercials were short the Gold Market, as it went above $700. Now that we have dropped over $100 per ounce, notice they have become buyers of this market.
We are in a free fall at this point, so do not just run out and catch the falling knife. In fact, we are on the verge of breaking the long term uptrend as I post this. However, if this trend on the weekly chart holds up, we need to look for a buying spot here.
We are going to need a rally, because a weekly close at this current price will break that uptrend. This simple view, shows the power of watching the insiders in these markets. Alot of people were extolling the virtues of buying gold at the top. This is something that plays out time and time again. Do not be suckered into this hype. Fools rush in where wise men fear to tread. There is no better recent example I can find than this chart of that tendency.
Saturday, June 10, 2006
LIAR LIAR
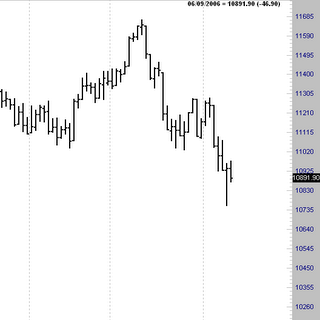
A great movie title, and also an appropriate name to call most of the Wall Street cheerleaders. One in particular, caught my ear this past week. John Augustine, when asked by a CNBC reporter how he viewed the recent decline shown to the left. I view it as a "Risk Reduction."
HUH? From the high in the Dow, to the low of this past week, the market dropped 912.50 pts, or 7.8%. How in the world is that a risk reduction? I guess it means, that it has reduced the risk of you making a profit this year, if you rode it down?
As an individual investor, please do not listen to these clowns. They are worse than clowns, because clowns, do not deliberately mislead you. I certainly understand that he might think, this is a retracement in an uptrend. However, to position this as a risk reduction is an outright lie. Does anyone looking at this chart really think there is less risk now, than there was 30 days ago?
Keep in mind that these guys get paid more, with larger investment pools in their funds. As a result, they do not want money coming and going. This I fully understand, as that is more difficult to deal with as a money manager. However, my thinking is, that I would rather make my clients a better return. Over, the long run, this should result in more investors coming into your fund.
Friday, June 09, 2006
US Dollar
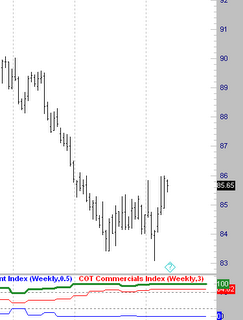
I had mentioned previously in this blog, and also in my monthly newsletter, the possibility of a rally in the dollar. Here is a daily chart of the dollar index. We do appear to be breaking out of a downtrend to the upside here.
This is yet another example, of where the commercials had given us advance notice of an upcoming rally. If you look at the graph at the bottom, it is clear that the commercials are heavily long this market. When this condition exists, rallies often follow. This does not mean you just blindly take a long position, just due to this alone.
What it does mean, is that you should begun to look for long side entries when this happens, and be very careful, with initiating any new positions on the short side. This has been choppy the last month, and they did serve up the classic short trap on that new low, that was immediately reversed on Monday.
Thursday, June 08, 2006
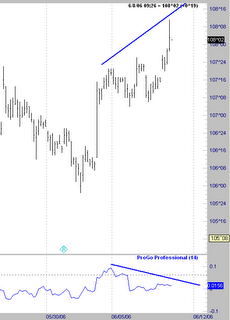
Click to enlarge on this image if need be, there are two lines that need to be viewed. This is an intra-day chart of T-Bond futures. We are short this market in my daily trading service, and the trade is going against us. Often, there is a "flight to quality" in the midst of severe stock drops.
I have posted this chart so that you can see they divergence between price, and an indicator below, which measures insider buying and selling. Often, but not always, when the insider buying lags the price movement, the price movement is reversed.
This is just for those of you who may want to trade off an intraday chart. I do not. However, while observing the markets over the years, I have noticed that this type of formation on a short term trading basis can be of value. At times a price move can just keep going in the face of this, effectively, eliminating the divergence.
As a result, these divergences need to be used carefully. You can also see one at the low before this upmove, where the price was dropping, and the insiders were not making new lows. This divergence, would have helped someone possibly spot this upmove that has occured.
Time will tell if this is a sign, that this trade will come back in our direction. Like everything else, this needs a trigger to go with it, so that you do not just step in front of the freight train blindly.
Wednesday, June 07, 2006
S&P Trade Follow Up
As you can see from the red carrot, this trade was stopped out for a loss today. I think you could tell that I suspected this was going to be a losing trade. However, since I could not find an objective reason for not taking the trade, I followed the rules absolutely.
One can never know by guessing, when a particular pattern will not work as it has historically. Systematic trading removes this type of doubt and second guessing. I could have easily manufactured a number of reasons supporting my thought, that this setup would fail. However, when you get into that vicious cycle, you never get out of it. You wind up second guessing everything you do. The emotional toll this can take is substantial. By trading systematically, with disciplined money management, all the trades are basically the same.
At times, you just have to stick to your guns, and take the good with the bad. Taking losses is part of trading. If you are not prepared to take losses, than this business is not for you.
One thing that is becoming clear right here is the insignificance of the 200 day moving average as a support point. This is something I have mentioned before, now you can see it actually playing out live. There is no magic to this line.
Tuesday, June 06, 2006
S&P Trouble?
To the left is a chart of the daily S&P 500 futures contract. Notice the green carrot, which indicates a long position entered this morning. You can sure bet I felt like a "real genius" as the Dow was down 120 points, and I was long! I am supposed to know what I am doing!
Why in the world would I be long, when I have constantly talked about the overall likelihood of a down market here into the fall? The answer is simple. I trade short term in many markets as well as long term. I was short the day before, and made a nice profit. However, this short term pattern, has been historically bullish, itleast for a few days.
As a short term trader in this market, I need to follow what my patterns and trading systems tell me. Often, this will be trading against the overall trend in the market. This is where the discipline comes in. I have no idea whether this trade will wind up as a profit or a loss. I will follow my trade rules, with exit points, and stop loss protection. The rules will determine my fate in this trade.
I want to post both good and bad trades in this forum. Some people represent, that it is just as easy as clicking the mouse, and the money just rolls in. This is absolutely not true. Even in the best of times, some losses will occur. We will follow this trade in here live until it's conclusion.
I hope to gain credibility with those of you that visit here by doing this. It is very easy for me to just tell you about all my wins, as the majority of my trades are wins. By going through trades like this, that do not look too good right from the get go, I hopefully can give everyone a good feel, for what really happens in trading. Often trades go against you initially, and this is why we use stop loss orders. These protect us, when things do not go as expected.
Monday, June 05, 2006
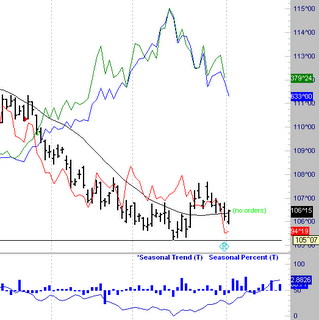
Crude Crud
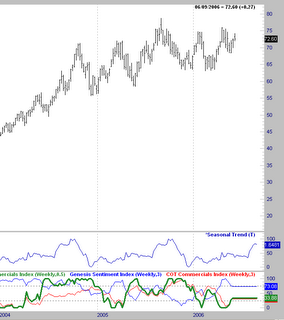
To the left is the current weekly chart of Crude Oil. You can click on it to enlarge it. This market is simply not offering up a darn thing right here. As can be clearly seen, we are in a sideways trading range, in a long term uptrend.
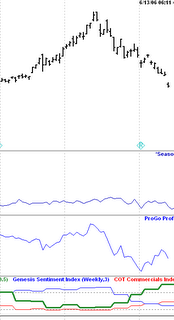
From a seasonal standpoint, there should be some more upside. However, we have to be a bit careful with seasonals. They do shift around on us from time to time. Recently, Crude has been following the seasonal tendency fairly well. Just look at the first chart below the price, which has the seasonal trend plotted.
The commercials, are somewhat in the middle, closer to short than long. However, not enough to really signal anything. Where does all of this leave us?
Actually, nowhere. It is anyone's guess which way we go from here in the near term. The bulls cite supply demand fundamentals which call for ever higher prices. They may be right, however, just blindly buying it here is a complete guess. I do not like guessing. Let CNBC work over this topic everyday, it is a dead duck for me at the moment.
Sunday, June 04, 2006
SOYBEANS
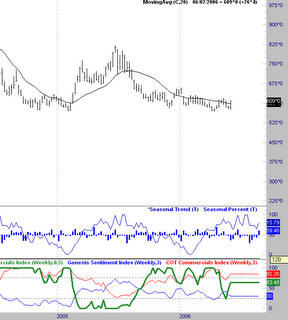
To the left is a soybeans futures chart. Notice how well the combination of seasonal highs and lows, and commercial positions at those points in time, signal price moves.
Most recently, the seasonal low in the first quarter of this year, has not produced a rally. This seasonal low, also occured at a time when the commercials were heavily long the market. "Well, see what I mean, this stuff doesn't work." That could very likely be a quote from any detractor of this approach.
As I stress repeatedly, these fundamental things are tools as a staring point for a trade, not absolute trigger mechanisms. Clearly, at this point we are in a downtrend in price, and there has been no rally attempt at all yet.
If you notice the last time times these 2 tools were lined up Feb of 04 and June of 05, something else accompanied them, that is not present yet in our current setup. This was a trend change. What this would translate to in today's setup is that we need an upside breakout of the downtrend before looking at the long side. Now, since we are close to the normal seasonal high, the oddss of a big long side upmove are diminished. Yes, it could happen.
This is where timing comes in. There are a number of ways of timing an entry once the fundamentals are setup. These are beyond the scope of this blog. For those who like to study things, this is a good starting point for you. Remember, my basic premise in trading is to line up as many things in one direction as I can. If I cannot do that in one market, I find another place where I can. Soybeans at this point do not have all cyclinders go, so onward.
Thursday, June 01, 2006
On May 25th I had posted a discussion of a long side trade entry that was not taken. I discussed why that decision was made. As can be seen here, that was a wise decision. That particular signal which had never been wrong, was this time.
How did I know to do this? I examined the pattern very closely, and found something in the current setup, that had not been present in any of the prior trades. As a result, I modified the setup to exclude this unique circumstance.
I could have easily just fired the black box signal off, and taken a loss. At times this is the correct step to take. However, the premise behind the entry setups always have to be kept in mind. If something at hand in the present, makes it unique, it is better to pass the trade by.
I like trading when the deck is loaded, not when there are question marks. Not every decision like this one turns out to be correct. However, over the long haul, this type of analysis provides very good returns.
Subscribe to:
Posts (Atom)