DISCLAIMER

PLEASE READ THE DISCLAIMER AT THE BOTTOM OF THIS PAGE WHICH APPLIES TO ALL CONTENT IN THIS BLOG AS WELL AS ANY OTHER MATERIAL FROM WE ARE FUTURES TRADERS LLC. READING ANY CONTENT BELOW CONSTITUTES AN AGREEMENT BY ALL READERS THAT THEY HAVE READ AND AGREE TO ALL THAT IS SET FORTH IN THE DISCLAIMER AT THE BOTTOM OF THIS PAGE.


Friday, October 29, 2010

OOPS


We all have certainly said things at times that we wish we hadn't and immediately tried to find a way to work ourselves out of the mess we created. The trouble with having your governing style being "smack talk at a pick up game at the Y," is that once you are running it anything can come out. It really does not matter at the hoops game, but as the President, it actually does. He is certainly privy to many things none of us need or want to know. One of the things he is privy to on some level, is what the PPT is doing right now. When the comment "we've done things you don't even know about" comes out, I have no way of knowing exactly what he was referring to. It was most likely many things. I am fairly sure that amongst that list was the urge to brag about how they have saved the US Stock Market. However, it would hardly be appropriate for him to tell everyone how they buy futures heavily when intra day declines occur to make sure they do not last.

Wednesday was another vintage performance by the PPT in my opinion. The market was collapsing, down about 150 and accelerating. Of course as we have learned, this means buy with both hands and it was. This very unnatural intraday turnarounds are spectacular, but there will come a day where their futures buy programs will not be enough to stop this. When you build these huge air pockets, paybacks are a bitch. For now though there do not seem to be any paybacks on the horizon. I do not see why they won't even allow a 2 to 4 day correction, but what do I know. There is not going to be any decline before the elections, they just won't allow it period.

I continue to look for short term sell signals just because that is what my techniques I have learned over all these years, are telling me we are setup for. Unfortunately they are losing trades right now due to what I described above. As a result I am taking them with small size. This is a judgement call, but when you know you have a manipulated market you can't just throw away all your money foolishly. At the same time I cannot ignore valid signals that are showing up for an arbitrary opinion like what I stated above. So I am just giving some back right now. Oh well. I am not stubborn, I am just following my rules. I will go long when buy signals develop. Until then I will just sit back with small size and marvel at what is likely to be the most unique time in history. Going forward once this last 2 years is reversed, it is unlikely the government will ever control all asset prices to the degree that they are doing so now, and we can get back to normalcy.

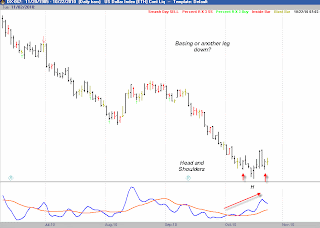
The Dollar Index below still seems to be basing here for a move upward, but I do have one concern here. We are using alot of upward momentum in the oscillators without much progress upward. At times this works like a stopped up drain that finally clears. If we don't get going to the upside here soon, this could have another big leg down.


I have traded this market a couple of times on the long side and basically scratched both the trades. The first one I completely mismanaged but the second one just never went anywhere. I suppose if today were to clear yesterday's high one could go long, but I doubt that is going to happen. That would require a sharp stock sell off, which is not likely. Other than that virtually every market trades in conjunction with stocks, so I doubt many shorts are going to work right now. You might want to focus on long side trades until at least after Tuesday.

Wednesday, October 27, 2010

DIFFERENT PERSPECTIVE


I talk so much about daily trades because that is the time frame I primarily operate in. Above is a weekly chart of the SP 500, and the strength of the recent rally is loud and clear. I have marked on the screen what might be a pipe dream, but it never hurts to wish for something. A pullback of about 40 to 50 points would drop us into a very good buy zone. Will this happen? God only knows that. Every dip of even 15 minutes or so seems to be bought "aggressively." No sense spending any more time railing on this buying, readers know what I think is behind that. The big challenge is how to manage all of this.

If you step back and look at weekly charts a couple of things jump out. First, pullbacks against trends can provide great entry points to ride trends. Second, pullbacks in strong trends do not occur that often, so you need to be on them when they do develop. The stops are bigger so your size has to be smaller, but your gains will also be larger. If am hoping we pullback to the zone indicated above, and will at the very least look to aggressively buy stocks on daily charts if we get there. You can see how closely we are following the seasonal pattern here, so if that were to continue, a large pullback would not be likely. However, a pullback I think would surprise quite a few people, the world is certainly very bullish right now across the board on both stocks and commodities.

I am very surprised at how far some of the commodities markets have run, but as Howard Sterns father used to say to him, " I told you not to be stupid you moron." This is a planned escalation by the PPT so that is one explanation for why the crowded trades have worked for so long. I am a "dumb ass" for fighting this. In a normal cycle these excessive sentiments would reverse alot of these markets or create pullbacks in the trends. This is not a normal cycle. We just have momentum blow offs in quite a few of them. The problem that I see is that it is the weak hands that get involved late in things, which is what creates sharp reversals when they start. The weak hands tend to panic when they immediately find themselves losing money and push the sell buttons quickly. This can accelerate a reversal particularly at key points like 20 day lows.

It is very difficult to time when this will happen, and that is why reversal trading is such a difficult task. You take alot of small losses hoping to eventually catch big wins. The hard thing for me and most others, is that you get demoralized after a string of losses and therefore do not have the right mind set to hang on to the one big one you eventually get on the line. That is why I do not recommend trying to step in front of big trends. I have been run over my share of times trying to do it. So, for the average person, I think if you are not already long stocks, you should wait for a pullback, then get in aggressively. Today it appeared that one might be starting, but there have been alot of fakes and the PPT has made a habit of late day saves on all of these, so we won't know until a day or two from now if this is a pullback to look to enter on, or just another small wiggle that "they" corrected quickly. One of them will ultimately go down for a few days, but it is impossible to know which one in advance.

As a shorter term trader I am trying to play these, but have been kicked around a little trying to do so in the last month.

Tuesday, October 26, 2010

FALSE ALARM?

So far no entries following up on my alert on Saturday


Here is the Russell 2000 Index and as you can see Friday's low did not get taken out yesterday, so there was no short entry for me. I also do you see one for today, but I am watching this closely here to see if one sets up. As I listen and observe what is happening in the foreclosure business, it seems eerily similar to the financial markets. It is my understanding that foreclosures in the legal system are state matters not federal. Yet Barry and company move on. Do they truly think the laws have no application to them? Apparently so. Keeping power is worth breaking the law.

Well here he goes again I bet some people are thinking, but hang on for a moment. This is relevant because what he and his minions the PPT are doing in regard to the stock market is exactly the same. If you and I were able to manipulate the stock market they way they are ( if we had the power ), we would all be thrown in jail on a number of different charges. It is just shocking to me that more people are not completely up in arms over this. This is completely unbalanced, and will lead to a monster crash at some point. As long as volume stays so light their games work, but if we ever get a big selling wave, they will not be able to stop it and it is why these "flash crash" types of things keep coming up. The market is being kept artificially away from it's true equilibrium level.

However, this needs to be kept in mind because in the near term you can literally buy any dip of 30 minutes or less knowing the PPT will come in with buy programs to prop it back up. Once the mid term elections are over, I expect this to change quite a bit. Net net, I think longs are correct but you need to have an exit strategy with a short leash, and don't go to sleep without having it in place every night. We might just sail along, but there is going to be a day where you will wake up and we will open down heavily and just roll like the infamous day earlier this year. History has shown us time and time again, that artificially forces prices to certain places does not work in the long run and creates large counter reactions. Can you say real estate?

Also you can look back in time at a lumber chart where the government tried to artificially keep the price down and the explosion that took place there. Oil and it's crash, another manipulation of price. Gold will befall this fate as well at some point.

I will continue to watch for a sell signal here but don't have high hopes for it. I have never in my 20 + years of trading seen anything like this, so I guess this is a new horizon. Who knows if in 2 years when Barry gets kicked to the curb if the new leader won't continue the same game. If he gets away with this for that much longer we will be in new all time high ground in stocks, and I doubt the new guy would want to be the guy who presided over the implosion. Time will tell.

In the meantime, there is one other development that might give us a hint on where stocks are going. My apologies, my genesis software just imploded so I can't get a chart in here. It was going to be of the Dollar Index and how it appears to be possibly putting in a low.


Saturday, October 23, 2010

SPECIAL ALERT

I have never done this before but I feel compelled to do so right now


We have just been sailing along nicely here for quite some time, it has been solely done by the government, but so be it, one helluva rally has taken place. I really had not expected any flies in the ointment for quite some time, then all of the sudden yesterday happened. Recent Larry Williams seminar attendees will recognize the pattern I have marked with the arrows in my timing indicator. Although as I continually state, this is not his indicator, and does have different values, the pattern is still the same here. Please no questions on this, I will not explain what it is. However what I will say is that it is a sell signal. It is a bigger picture signal, so we need something more than just this to sell short. You can see we are technically under the Trend line which is the orange line. I will not get into the specific reasons as to why this is a sell, Larry's students who read this will know that. If you are not a student, you are just going to have to take my word for it.

Fridays low has to get taken out for the entry, so if we just sail up from here, this will be nullified. However, we do have somewhat of a trap pattern here, and actually the correct market to short is the Russell 2000 which has not taken out the recent highs, and has actually made a lower high. That is where I will be trading Monday. If we couple this with the following chart, we begin to see a consistent picture here.


Here is the Dollar Index. There were some shenanigans late Friday with the electronic pricing, I have no idea if that plunge is even legitimate pricing. I looked at 1 minute charts and saw alot of trades so I suppose it was, but it happened at a time during the day when price normally does not trade at all and none of the other currencies did anything, so I think this was a keypunch error etc.. Even if it was not the market is still setup for a buy, and since we know stocks and the dollar index trade opposite nowadays, this makes sense.

There are also sells in energies, individual currencies, and a couple of the grains. In summary we appear to have what might be a very unusual selling opportunity, and something that could move down very fast. We know the PPT is trying to artificially keep all prices on the rise, so that is the fly in the ointment. They are likely to throw untold amounts of money into this if we get going down to try and stop it. However, we cannot control that. These are textbook signals for me, and ones I will play whether I win or lose. Opportunities like this do not come up very often, and it is why I sent this out Saturday. It will also serve as my Monday post as well. Keep in mind these are not sell at the market, you have to use whatever entry techniques you use to trade with and of course protective stops. One last chart I wanted to show is Copper, a market that very closely correlates with stock prices. Blogger is not allowing me to upload right now, you can look at this chart on your own.  Notice how it is a bit weaker than the SP500, which could be a leading sign of some coming weakness.

This situation kinda snuck up on me, and we certainly know from CNBC, there is nary a bear in the world right now. A move down would surprise alot of people, millions literally, so that is why I really think this is worth a swing and why I will be swinging if Friday's lows get taken out.

Friday, October 22, 2010

TO BE OR NOT TO BE


Here is how the Dollar Index looks right now. The magic question of course is, are we making a low or just hesitating before another leg down? By the book from a technical standpoint with my short term oscillator above, we are potentially making a low. If today were to close down, a buy signal for Monday would be in place. You can see the nice symmetry on the short term reverse head and shoulders here that I have marked on the screen. If we combine that with the oscillator being in an uptrend, it says buy.

Just thinking out loud here with a random opinion that I will not trade off, here is what bothers me about this. For a significant low to form here, we need a decline in the stock market to also happen. With the PPT the most active it has been in history, we really have to ask ourselves how likely that is? They have openly stated their goal is to inflate asset prices, and will use all the tools at their disposal to accomplish this. If we combine that with the strong seasonal time window we are in now, it does not seem too likely too me that a major top is forming in stocks. This feels like the 90's again all of the sudden. Since these two, stocks and the dollar are trading at a close to 100% inverse correlation right now, it seems highly unlikely the dollar could rally and stocks would not decline. This trade then becomes by default a bet against the stock market.

I will still take this trade because I do not trade based on opinions such as what I just discussed, but I do not have high hopes on this one. However, maybe my opinion on stocks is wrong, which again is why trading on opinions is so difficult. How do you know which ones are right or wrong? We also have alot of commodities looking a little top heavy to me here, which does support a rally in the dollar. The next chart is the SP 500, which in my mind just does not have a clear trade in either direction. We have a tight narrow band in the timing indicator while price moves steadily higher. This is not really a divergence, or a gangbusters uptrend to support the move, hence it is no trade for me. I want my trades to jump off the page as being obviously one of my patterns, and this as much as I am trying to force one, just does not meet that criteria.


I wish this had more clarity for me but it does kind of make sense that it does not since this whole move is being escalated by a narrow group of people in power. Prices are not rising for the traditional reasons so why would the indicators line up? The whole thing makes no sense.

Thursday, October 21, 2010

Quasi Important Housekeeping Item

I have mentioned that I entered the Robbins World Cup Trading Contest again this year. I did give one update on it where I was ahead about 70%, don't recall exactly. Several difficulties have arisen with trying to manage this account with the Genesis platform, a couple of which have cost me some money. The issue is this: when you have multiple accounts using the genesis platform, there are problems getting all the orders executed correctly. Apparently as I have recently learned, if you are not logged in to a particular account, any OSO ( order submits orders ) do not work. I have 2 accounts there and about to be 3 because I am transferring over a large account to be traded through PFG and the genesis platform.

Generally I place the identical trades in my accounts with the only variable being the number of contracts. I place all my orders nowadays as OSO's meaning that once an entry order is filled it triggers a protective stop on the other side of the position. Since you can enter all these orders in advance, I as well as many other genesis users assumed that all the orders were working. What I learned as the guinea pig for everyone else recently was the following. If you have an order in one of your accounts for example to short the NQ with a corresponding protective stop on the other side, you get an order number for the entry but don't get one for the protective stop. What this means is that the protective stop is synthetic order on your own computer only and has not been sent to the brokerage firms servers. If you then log out of that account and log in to another one and place the same order you would have thought you were covered, and that the order in the other account would transmit once the entries were filled because you are still connected to PFG, not so fast grasshopper.

What I learned the hard way is that the only protective OSO orders that will be submitted are for the account you are logged in with at the time, nice surprise huh? As a result, I had thought I was filled and out of a particular position in my contest account and was not since I happened to be logged in to the other PFG account I trade at the time price traded through the number. I discovered this error quickly but it took literally 2 days of phone calls to try and figure out what the hell happened, all the while this trade was running against me. Nobody could tell me what my position was. I finally just ignored the "not held" disclaimer from the brokerage firm and went to the market to offset what appeared to be a losing short trade. This wound up as of course double the loss it should have been. So what we now know is that contingent OSO orders sit on your computer forever unless you keep logging in and out of all your accounts back and forth, which is just quite frankly a fiasco.

Since we have these monster overnight moves almost on a daily basis, this has left me with having to get up several times during the night to make sure I had stops in when orders fill, and I just cannot live like that. As a result, I am going to fold my trading account balance into my regular account with PFG, hence you will not see my name in the standings any more. This account as it is has been completely mismanaged by me anyway. I have forgotten about it at times and as a result not done trades in it that I did in my other accounts, as well as a few other mistakes. It is just not worth bothering with in light of what I have just described.

I did not want people to think it was because I had lost money, that I am not in the standings anymore. The account is only about +60% now anyway, that error was about a 10% hit bringing me down from 70%, so maybe I would not show on the leaderboard anyway, but I wanted to make this note for the record. Once I get my IRA moved over I am still going to have 2 accounts to deal with this issue on, but 3 would just be impossible to deal with. Genesis is supposedly working on a fix for this issue, but there is no definite timetable set for it so I have no choice but to do this. We are talking about hundreds of thousands of dollars in my accounts, so I just cannot risk getting burned again with this.

Maybe next year if the software issue is fixed I will re-enter again, but I will not deal with this anymore it has been a royal pain in the ass especially this last week with this error in the orders which was no fault of my own.

Wednesday, October 20, 2010

ANOTHER HEAD FAKE


Yesterday provided yet another spectacular bear trap for many of us, and I say us because I got burned. There have been several of these in the recent spectacular bull market run in stocks, but this one really was a beauty. One of the things you just have to accept as a trader is that when you trade against the trend even on the entries that appear great, many of them do not wind up working out. My DX trade had over 10k in open profits at the close, but I wound up exiting on my trailing stop with just about a grand or so. I have to admit I really thought we were off and running on a short squeeze there but it was not to be. Better than a loss I suppose. Crude Oil turned out the same, a complete wash out down yesterday leaving me with about 4k per contract in open profits, Poof this am, wound up with about a grand there also.

I knew when the PPT rallied the indexes sharply in the last few minutes of trading yesterday, that trouble was likely brewing for today for my trades. When stocks rise now so does everything else except the dollar and bonds. However, you just never know so I left my stops in just in case I was wrong. I am really trying to ride things longer now, so this is what comes with it, alot of one day wonders that wind up as small wins. I could have easily taken quick profits, but in markets with these monster trend moves we are getting now, I think we have to go for more nowadays.

Above, we might finally have the world's favorite market setting up for a short entry in a few days. The short term trends have turned down, now what we need is a price rally for a few days so that we can enter on a reaction to the new short term downtrend. We might just fly right up out of here, but so far today with the huge stock rally, Gold is really lagging, which it has not been doing in recent days. Also, in spite of the DX wipeout today, that market still appears to be bottoming here. That does tie in to a GOLD short, so it all fits.

It also appears to me that the Bond market is now setup for a short entry tomorrow. See the chart below, a reaction up for 3 days against a down trend. I will be playing this one.


I have drawn in what today looks like, I am having internet issues again due to the rain here in San Diego. Whatever entries any individual might use is up to them, but this is setup for a decline. I am also looking at the Cotton market on the short side, and for the DX to setup another long entry in a few more days.

Tuesday, October 19, 2010

CASE IN POINT


For those who read my blog regularly I am sure you figured out that I was likely to go long the Dollar based on my recent comments. The above chart shows that long entry and where the trailing stop is for today. I had also mentioned currencies were setup for sells. I did also short the Pound, but bailed out of it a bit early because I did not think the bar pattern was that great. Since I was already long the dollar, that was basically the same bet anyway, so I did not want too much riding on the same trade. I am also short Crude Oil which I will show below.

As I stated very clearly yesterday, I trade on technical patterns not on my opinions. I doubt many people were long this trade where I was, but there are some piling in now. Also, the world is short this market and long commodities, so some of this is short covering as well. Let's be honest, being long the dollar and short commodities in recent weeks would not exactly have been the recipe for longevity as a trader. This is exactly why I railed yesterday on not trading on one's opinions. I really have no opinion at all on the dollar and where it might likely go, I just don't care. Why in the world would I want to read a bunch of gibberish from armchair quarterbacks ( economists ) about their theories on where the economy is going? Has one single one of these guys ever made any money investing  their money, or do they make it writing about what others should do? At least with me I put real money behind my ideas, and don't get paid by telling others what to do.

You can see on the chart there was alot of divergence in the timing indicator, and then we got a strong up bar in price. This was enough to take a swing on the long side for me. There are other things I look at as well that are not displayed, but this is the net reason I went long. A pattern based entry in a market that was setup for an up move, that simple. No arcane theories about QE, or Fiat currencies, etc, none of that crap. Maybe we just reverse back down and this does not work out, I don't care. I know if I take all these trades when they develop, in the end I will come out quite a bit ahead.

Obviously, for this trade to work, the stock market needs to decline some. We have seen recently one blatant move after another by the PPT to prevent any even 2 day decline, so we know they are lurking. They have micromanaged asset prices so closely recently, it makes me wonder if they are watching 5 minute charts! They are not going to like one bit this little decline that happened at the open, so we will see if they show up to try and reverse it. I expect they will, but at some point you would think they would at least let a healthy correction happen. We know from looking at institutional volume and how much it has declined during this recent run upward, that they are not the one's pushing this market up. You can be sure though that the PPT does not want any type of stock decline before the mid term elections are over, so don't anyone get too excited about the prospects for that here. I do think a down close in stocks today if they allow it, will setup a possible buy signal for tomorrow there. As to the DX trade, I will trail this trade with a stop and see what happens, no expectations, just rules about how to follow it and where to take profits if we get there.

I said above that I wold post the Crude chart. I have intermittent internet due to the rain here in San Diego, so I can't get connected to get a current snapshot of the Crude chart. You are not missing anything it is a marginal trade to say the least and with the PPT save that is going on as I type this, it is likely to be no good in the end anyway. They say death and taxes are the only guarantees in life, but I would add one to that list. If it rains, your satellite internet will not work, that is a guarantee!

Monday, October 18, 2010

DUMB MONEY


As I watched last night ( Sunday ) and saw the decline across the board, I went to sleep knowing when I woke up it would not last. The Dumbest money just has to be the Sunday night index traders. I do not have a specific count, but I must have seen 20 declines in a row on Sunday night get reversed like this before the NY opening. I am looking to buy a decline at this point but as you can see from projecting tomorrow to move up above what so far is today's high, the momentum indicator does not turn up. Although this indicator is slightly different than the one I trade with, that also shows the same thing here. You can see with the other 4 red arrows, that the good upward moves had good slopes in the the CJ short term timing line. There was one exception which you can see recently, in that we have been rising the last couple of months without any momentum confirmation in the timing line. That is unusual, but does happen from time to time. Since this recent move has solely been driven by the futures indexes with very low institutional participation, that may explain this discrepancy.

What to do next? This is simple for me, look elsewhere for trades. I am bullish on this market, but I still have to have my patterns to pull the trigger, and none of them are here yet. The way this indicator works, as well as the other ones I use, there are two scenarios that I see that could take place. First, we could just drift for a day or two, then the line could turn back up confirming a buy signal. The second scenario is that we drift for a week to a week and a half, then it turns down, which would be a sell signal. It is my opinion that the PPT is not going to allow this to roll over before the elections, so I doubt #2 plays out but you just never know. This leads me into what I really want to talk about today, and it is a response to John's comments in one of the other threads about the dollar.

It should have become loud and clear for daily readers here of my blog, that I stress trading on technical studies, not on my opinion. I do throw my opinions around just like the one above about the PPT. However, I do not trade based on them at all. John, your comments about the dollar and with the QE the fed is doing, and the printing of dollars you say is going on, that might well be true I do not know. What I do know is that I do not care. That has absolutely nothing to do with how I trade. As I have said time and time again, opinions are very difficult to trade with. I think it is mandatory to review your past trades to see what you have done right or wrong. It is very easy for me to look back at something 6 months ago, and look at my indicators and learn from my mistakes, or even pat myself on the back for doing something correctly. How exactly would I go about doing that if all those trades were based on my opinions at any given moment in time? I would have to make a journal and write down 20 pages of notes with all my thoughts at the time, so I could go through all of them to try and determine which one of my arbitrary thoughts led me astray. I suppose you could do that, but I doubt anyone could completely recreate their full mindset 6 months hence, to really understand what went wrong.

I will not argue against some of the theories that some of my readers have about the dollar, and how a greater supply should make it worth less. I have some very bright people that I trade emails with that read this blog, and for all I know, they know way more about such things than I do. This all comes down to what your trading style is, which I covered in detail in a post quite some time ago. There are many different ways you can go about trading, and I am for the most part a 3 to 15 day trader. As a result, alot of these types of things are just irrelevant for time frames such as that. That time frame is where I think the ultimate risk vs reward ratio lies, and that is why I focus there. There is alot more pressure to get things right when focusing on longer periods of time because you get less trades. Here is an example that for me reinforces all of this.

I have been dead wrong about the GOLD market with my opinion, and been wrong for about a year. I have thought and continue to think this is the biggest bubble in the history of mankind, and have been and continue to be wrong. I have many readers here who have been right. However, I would bet about any amount of money that I have made more money trading Gold and Silver than any of the readers of this blog. How can this be? If you are a long term investor, you have to be careful about how you allocate your capital. It is unwise to put too large of a percentage into any one thing since you won't know if you are right or wrong for years at a time. However, as a short term trader, you can leverage things much more heavily. Also, I trade both sides of the market, and any readers here are well aware on some of the nice moves on the corrections to the downside, how I have pegged these pretty well and taken very good profits. I have also gotten on the long side several times, so even though I did not buy Gold at say $400 and hold it, I went in and out many times with larger size, and took a good amount out for myself.

This is why I trade within the time frames I do. It is up to individuals to select what is best for them. However, this is why I just don't concern myself with bigger picture economic views, even though I have them just like everyone else does. They don't make me money. If any individual reader has a view they feel strongly about, and opinions is what you use to trade, then you should invest your money accordingly. The point of today is just that I do not go about this business that way.

Thursday, October 14, 2010

TIMING IS EVERYTHING


John you had asked some interesting questions in your comments yesterday, so I thought I would try and address some of them today. Of course as most of us know, it is not as important to be right or wrong on something, as it is to have that view at the correct time. There were many people right about the housing market crash, yet were 5 years early and left millions of dollars on the table. It was hardly worth much being bearish on housing in 2000, but was worth quite a bit to have had that same view at the end of 2005 like I did, when I sold my real estate trying to time the wipeout that ensued. That was a seven figure difference in my case.

As far as the questions on how to protect yourself best against a significant devaluation in the dollar, I am probably not the best person to comment on that for a couple of reasons. First, I do not share the view that is going to occur even though at the moment the world looks like it is ending with the DX. I do certainly understand the reasoning behind your views on this and you may well be right. However, I am a trader with a shorter viewpoint than you have, and I see an incredibly over extended market move right now that appears to be to be setting up a base for a reversal. My indicators are diverging very sharply now against this move.

I do get concerned at times that people get a little too cute with things like this. For example, it appears to me that the better use of sideline money at the moment would be to go long stocks on the next pullback we get if it occurs in the next 2 weeks. If it is not until March, that is a different story. Getting tied up in a lot of vagaries of exchange rates and all of that just to protect principal does not seem prudent to me. I would like to bet against Barry and I think that is prudent, but it is starting to appear that the public has finally realized what a terrible mistake they made, and are about to begin to remedy that. If someone could guarantee me he would be re-elected and have a democratic house and senate, yes I would say to bet the farm against the US Dollar. However, it does not appear now his agenda is going to get advanced much further, which should mean things will begin to get better for the US.

With all of this in mind, today I am going to cover how to enter trades once you have a bias, or at least a few ways of doing it. On the Euro chart above I have marked all the correct entries that could have been done here. In real life nobody would get every single one of these perfect, but I did do some of these trades that are marked. First at the low, is my favorite type of pattern, what I call a trap. These are quick moves out of consolidations that quickly stall and reverse. I do not have the stats, but I would be willing to bet that a good percentage of my profits come on trades like this. You are generally completely against the public view on these types of things because the reversals happen out of the blue just after the last person enters on the wrong side of this. I am hoping for something like this to setup in the DX on this move down. There are alot of different variations on this general theme, which is to look for an immediate reversal of what appears to be a breakout move. You then go with that reversal.

The next several entries are very simple just retracements against a trend that last 2 to 5 days. These quick ones are best, the ones that meander around for a couple of weeks, are not as reliable. Here you can either just buy at the market once you get a couple of days down, or wait for a prior days high to get taken out indicating the underlying trend is resuming. It has been written that these are the highest probability trades win to loss percentage wise. My own research does not confirm this, but it does confirm these are good trades to take. They are very easy to spot. I know that Linda Bradford Raschke has written in her books about these types of setups calling them the holy grail trades. That has to carry some weight since she is one of the all time great traders.

The next setup, the sell at the top there is your basic divergence in an oscillator type of trade. You can use any indicator you like to do these, alot of folks like the MACD. I am not a big fan of that, but I suppose it must have some value. These trades are more tricky. Often in trend moves, you get these types of looks over and over, and they are false indications of turning points. The Aussie Dollar has had this look now for a couple of months, and it is just skyrocketing. It is my opinion that when trying to do these types of trades you should also try and combine it with a trap type of bar pattern, like the first example. Also, the British Pound right now has this type of setup developing. It also could be some other type of price pattern that has an "edge" in predicting future price direction. This should help keep you out of trouble. The biggest difficulty with these is that the good ones are do darn good, that they lure you in and you wind up chasing a bunch of marginal ones getting your ass handed to you in the process, hunting for the next home run trade. For beginners I would suggest not to try and do these types of trades. If you choose to do them, look for huge divergences and not small ones like the one I have marked on this chart. This one worked, but is really not an ideal example of these.

In summary, these are just some general types of ways to get into positions, and I hope this is of some help to you John and other readers as well. I have noticed some new readers from countries all over the world, so thanks for checking in.

Wednesday, October 13, 2010

SPECIAL TIME IN HISTORY


I have a question to ask all the readers that check in here. If you were in Las Vegas and the pit boss came by your table while you were playing blackjack and told you we are rigging the hands so you will win? Would you increase your bet size? I think most people would be skeptical but would do so to see what happened. There are some who of course would bet the farm and happen to do it on the one hand they lost on. This cannot be helped, but for the average person who moderately increased his bet size and maintained that over several hands, a big gain would come their way. After all they were told there was going to be a predetermined bias in one direction.

We are at a unique point in history where the Federal Reserve has just done what the pit boss in the above example did. They have outright told us they are setting inflation targets in an attempt to get people to spend more money. They have rigged the deck like at no other time in my lifetime, and told us up front about it. Ever since these announcements we have seen a lift off across the board, and a dollar wipeout. Now might be a time to tune out the Elliot Wave people calling for a 600 Dow or whatever their latest end of the world scenario is. I know I get emails from them and others every time we move up telling us how much things are going to go down. Who knows maybe they will be proven right at some point, but being wrong for thousands of Dow points and years of time is no way for most people to feel comfortable. You simply have to be flexible in this business.

I was bearish on the stock market recently, and tried to short the Naz twice, once for a scratch, and once for a loss. Now it is clear to me this market is a buy on any dip. I was wrong and have now switched my view. The same can be said for the GOLD market. I was bearish there for a long time due to fundamentals, and guess what, fundamentals in that market do not seem to matter at all. I have to accept this for what it is. It is a unique move historically for this reason, but the tape tells it all. This market is just blowing off upward along with everything else. Is it really a good idea to continue to look for a drop when something is rising that sharply? Of course not. This was a blunder on my part to have this view, but I was wrong and just have to admit it. There is certainly no sense in compounding an error with being stubborn.

We have been told by the government they are going to make prices rise, and they are doing so as we speak. As a result, look for longs, what else can I say?

Interestingly enough, the DX chart above does show some basing here on a very short term basis along with some divergence in the CJ Timing line ( explained the other day ). This bears watching simply because of the extreme oversold nature of this market. Many of the currencies show the opposite view. It has been my experience that when I see markets just creeping and crawling along like this day after day, trying to fade the momentum of them is a tough proposition no matter what the indicators are saying. They often will diverge during times like this. Further, when you have markets that just go the same direction day after day after day like this, trading them is very difficult. They just don't give you a way in which at times leads to spikes up then sharp down moves. This happens because eventually the last doubting Thomas relents, and of course does so at the very top of the momentum. Picking that peak is next to impossible, so don't engage in that exercise. This only comprises less than 10% of the historic price action so you cannot tailor a strategy to this alone because it won't work 90% of the time.

The government has spoken loud and clear so be careful fighting this. I am more interested in buying the pullbacks, especially if we happen to see a 3 to 5 day period where things drop dramatically. Will we see that, who knows?


Monday, October 11, 2010

COMING TO A THEATRE NEAR YOU


Damn I hate this, agreeing with the public once again. The above chart is the 30 yr Bond chart and I have been talking about this recently as being setup for a sell. I cannot stand agreeing with the armchair economists, that is normally a way to get separated from your money quickly. However, I have to go where my trading patterns take me regardless of who else might be waiting there, and this pattern is a sell pattern in the Bond Market. If you also couple this with what appears to be a major stock market lift off in the process of happening, it makes even more sense.

First, a housekeeping note. Going forward the indicator that is displayed on the above chart is somewhat different from the one you have seen displayed here for so long. This is a indicator I developed on my own that is completely different than Larry Williams indicators, and does show different values. Even though I have honored the non-disclosure perfectly by displaying one of his indicators with everything hidden to conceal it, I don't think that is really what I should be doing. As a result, I have developed one that is similar that is derived from completely different logic, and does get to close to the same place. Larry is a friend, and even though I have fully disclosed it is his product and concealed what it is, I think it is just better this way. In any event, it is how you use indicators, not what they are that is the key. I will just refer to this as the CJ timing line going forward.

As you can see, the CJ Timing line is diverging some here, and the other thing I think is really important, is the huge lag of the 30 yr behind the 10 Yr Notes in price.


Look at this chart of the 10 Yr and notice how much stronger this has been. This is why in my longs in the interest rate complex, I have been playing here and not the 30 Yr. I would not consider this to be a sell in all honesty, even though there is some divergence here. If we look at what has seemingly overnight turned into a successful inflation campaign by governments around the world, we have to be thinking that means trouble for bonds at some point. Market interventions have suddenly kicked started inflation when they had failed to for the last couple of years. This is likely to mean higher prices in everything, and it might even lift real estate. Gold bugs should be thrilled, as stocks soar GOLD will continue to follow.

We can argue all we want about the economy being in tough shape and all these other things, but we have seen a very compelling case that the government can in the short run move prices to where they want to and they have decidedly voted for up. This brings about an interesting quandary with an interest rate rise ( price peak ) in bonds. They are manipulating prices through low rates, and have stated they are going to keep rates low for as long as is needed. This discrepancy between the 10 yr and the 30 yr tells us that is happening. Rates are being bid down in the shorter term and up in the longer. So it seems odd to be looking for a top here when this is going on. This may mean this big top in bonds will take awhile to develop, I really have no idea. I trade by my patterns, and they are telling me to look for a sell signal here. Maybe I am way early, but the COT report is also showing some bearish positioning, so we might have both fundamentals and technicals lining up here.

Make no mistake about it, if buy signals show up I will still take them here in spite of the bigger picture. The huge move down in prices here may take awhile, but I am looking for a big trade when it starts. At the moment the setup is a sell so that is where I am looking.

Friday, October 08, 2010

STRONG DOLLAR POLICY?


I heard someone the other night on TV from a political group talking about our strong dollar policy needs to remain in place. Does this look like a strong dollar to anyone? All the government interventions in the markets are driving the greenback into the dust. I would like for someone to explain to me how constantly injecting all this capital into the system is a strong dollar policy, it is the opposite of that? This has really been a sharp decline in the last month and a half as you can see on this chart. However, this is not without hope. We have reached an incredible extreme in this market now with the ADX reading 83 right now. In general markets tend to reverse direction once they get beyond 60 although there are exceptions such as Gold. Gold has reached several readings of over 60 and barely missed a beat, but that is an anomaly.

We also have one of the momentum oscillators starting to diverge quite a bit here, so it is time to start looking at this market a bit more closely. If we were to close down today I might take a swing at buying this Monday on a rally. I do not consider that to be a high probability trade since the trend is so strongly down here. The reality of this is that unless the stock market slows down a little, it is unlikely the dollar will recover. These two markets are trading lock and sync with each other in an inverse fashion. Which drives which is anyone's guess. By watching price intraday, it appears to me stocks drive this but many sharp people claim it is the opposite. I really don't care, but I do know that when I watch short term prices, stocks move first then the dollar follows, not the reverse.

The other way to play this same idea would be to short some of the currencies. The way I see it the one that is lagging the most is the British Pound, so that would be the one to look for a short entry in.


If you look at this and compare this to most of the other currencies it is clear that it looks completely different. Most of them are rising on a 70 degree angle, and are basically the opposite look of the dollar index. I think if the trendline above is broken, a short entry can be done.

That is all I have for today, good trading to everyone.

Thursday, October 07, 2010

THERE IS ALWAYS ONE SMART ASS


I am sure everyone has a friend who always fights the tide. You have situations which appear to be clear cut yet this one smart ass always disagrees. Everyone thinks of them as a doubting Thomas and pawns him off as just being negative. However, occasionally this dissenter gets one right. Nobody ever gives him credit when this does happen and he does not care, he keeps the contrary stance come hell or high water.

Above we have the Nasdaq, which in the face of essentially a global lift off in prices across the board, has not confirmed the breakouts. All the other indexes have, and bonds as well. Gold, Silver, the currencies, and other commodities markets are in blow off phases right now. Too late to buy them but nuts to short them. Yet here we have one that has not come along for the ride.

Is this significant?

One of the things I learned from Kevin Haggerty many years ago, is that techs lead. He is a seat of the pants type of trader who watches so many different things to formulate his view, I could never come close to mastering his approach. He is one of the best traders I have ever met. However, the one thing that has stuck with me was his insistence that techs lead. If we go back to 2007 we did see at the top that the sell signals were in the Nasdaq market first. It was the shift in the COT data on the part of the commercials to a heavily short position that tipped us off to the imminent decline that followed. We have just had that happen again, while it has not happened in the other indexes. There was a recent quick move to the short side in the Nasdaq futures in the most recent report.

I have been outspoken about how I do not believe the COT report has anywhere near the effectiveness that it used to have in predicting market turns. I do still believe this in general, but I have also said there are still a few things in it that are worth paying attention to when they develop. In this case we can almost see this on the chart, less buying in this index than the others, hence why it is lagging. It is difficult to attempt to try and weight professionals selling vs government interventions to push prices upward. Supposedly by law, the hedgers should be able to have unlimited positions whereas the PPT actions which should be in the large speculator category, should have limits. This would lead one to believe that the power of hedgers to move markets should be greater. However, we have seen one bogus number after another out of the government, so who is to say the COT data is even accurate. It would certainly not be a shock to find out the government relaxed it's own rules on position limits for it's own activities in the interest of the public good, and by an "oversight" forgot to report this. I really put nothing past them at this point, and I don't think many others do either. There also might be other ways that they are operating, I honestly have no idea. I do know that I have seen enough inconsistencies to at the very least question some of the data that is being released.

The point of all of this is that we do have one potentially meaningful divergence that is staring us straight in the face here. Tomorrow we have the big NFP report, so who knows maybe that will give us the lift off in the NAZ also, and resolve this problem. However, until these recent highs in the Nasdaq get taken out, I am going to remain less than fully convinced on this rally. It does look good in almost every other way. What I will be looking to do is as follows. If today we get an up close in the Naz that does not take out these recent highs, I will be looking to short it on a breakdown tomorrow. If we blow up and out of here, I will be trying to buy the first pullback, but I will do that in the SP 500 since that is a far stronger market.

We do have very strong seasonals and historical cycles coming up that are very bullish for the stock market. If I take my every day life and other business interests, and look at what they tell me about the economy as a whole, this makes no sense. This is why I always tell people not to make stock market decisions based on this. They have never been more separated from each other than they are now.

Wednesday, October 06, 2010

BATTLE OF THE BULGES

Here are two prominent markets both argued by some to be bubbles, which is the bigger one?


On the left side we have 10 YR NOTES, and on the right side everyone's favorite market, GOLD. These are weekly charts. It is obvious to see the dramatic rise in both, I am currently long the 10 Yr, wish I were long gold. I have talked alot about Gold in this blog, and quite frankly have been wrong about this market. I have traded it profitably, but my prognostications about this market have been dead wrong. In all the years I have traded I have never seen anything like what is happening in this market. The small speculators have never in history from what I can find, been able to drive a market this far for this long. All of my commentary on this market has been based on historical tendencies. Generally, small investors can push things for awhile, but usually are wrong in the end. I could show you thousands of examples of this. However, in this case they have been absolutely "dead balls on accurate." I have said recently that there is absolutely no reason to short this market at this point and that is obviously the case just by looking at the chart.

I have also mentioned how closely the stock and gold markets are tracking now. Since there appears to be now a coordinated global effort to inflate things with lower interest rates to fight off the deflation wave that is lurking, I see no reason why this market will come down anytime soon. That is ironically the exact same argument I would make about the interest rate markets. Since almost all of the countries are pledging to keep rates low, I think the upward movement in both of these markets will continue.

I still feel generally, that the small speculators in the end will be burned in the Metals markets, but they certainly have so much profit in the trades, that they will still come out net winners. There are periods where these people hit it right on, but over a period of time they do not. You cannot bet on the underdog in every single race and always expect to win, even though there is a Secretariat out there from time to time. Here is the COT picture right now, and once again the Small Spec long position is in the area where it has caused pullbacks/declines in the past. Also note the record net commercial short position. This needs an asterisk because that represents hedging activities and who wouldn't do that after a run like this? This does not mean they are overly bearish for tomorrow's prices etc.. It just tells us that they are protecting profits and doing so aggressively.


We are not yet surprisingly enough at an overvalued level versus the US Dollar, which is a reading that has been at a high point each time a decline has happened in recent years. As a result, I think this keeps sailing along unless the stock market declines. If we were to see a sharp stock market drop which seems very unlikely, this market would probably take a hit. I do still think big picture this is an enormous historical bubble that will implode, but I have absolutely no idea when it will happen. It does not appear to be on the immediate horizon.

As to Interest rates, they are a different situation as far as why there are declining. They are doing so directly for fundamental reasons. We have a bad economic situation at hand, and on top of that governments are lowering rates, hence the interest markets rally. This is a situation where the large hands are driving the price move not the small fry's. We are seeing interest rate markets rally at the same time as stocks, this is also unusual by historical standards. The argument here by the folks calling this market a bubble is that we will have to print dollars ultimately to get out of this mess, this will cause inflation, interest rates will have to be driven up to fight that move. That could ultimately prove out to be true, but for the time being the opposite is happening.

In summary, it is my view that at the moment, neither one of these markets is actually a bubble as far as immediate price movement. There are credible arguments as to why both of them could be on a larger scale, enormous bubbles that will at some point deflate. What has to be kept in mind here is that unlike any time in my life, governments are intervening and controlling pricing of asset classes. As a result, alot of the traditional ways of measuring market swings are not currently valid. I think just weekly trend lines or something very simple like that are the best way of alerting us to any major shift in either of these trends. So far they are solidly up and not in any danger of being broken, so up is the path.

For the record, I was stopped out of my Nasdaq short for a very small profit yesterday and the same on my long VXX trade. Too bad they both had big open profits going into yesterday. However, that should show the virtue of selling the weak and buying the strong. Some of my fellow trades shorted the ES which had been much stronger and took full losses, where I actually had a slightly better than breakeven on mine in a trade where I was actually wrong. I love it when I am dead wrong and don't lose any money!


FREEZE OUT

Stay tuned, Blogger is freezing me out right at the moment, not allowing me to upload charts. I will keep trying to check back in an hour or so and hopefully the problem resolves itself.

Monday, October 04, 2010

DECISION TIME


Here is what so far is another fake trapping short sellers on the wrong side of the market this morning. There was a legitimate short entry below the low of Friday, that was penetrated last night. So far this is another fakeout at this same level, the 1035 level seems to be very strong support here. If you look at where I have marked downtrend pointing to the momentum oscillator, you can see this has been diverging for quite awhile. My first thought about this and one that I have operated on for a couple of years, is that this is very bearish. However, upon further researching this pattern I have found that when it stays like this for awhile and produces no price correction, it is actually quite bullish. There are likely alot of stops in this 1035 area now so if the market were able to penetrate that area, it is likely we could fall quickly at least for a short period of time. I am talking about a short term time horizon with that remark.

We are right on the verge of that point right now, if we don't break here in the next day or two, I think we are going to have another powerful leg up. The one fly in the ointment is the significant divergence in the purple line, Larry Williams POIV indicator. This accumulation/distribution indicator rarely diverges this much, and is usually not wrong when it does. This would tell us we should get a move down. Researching this just stand alone, produces very bearish projections, so we have two somewhat contradictory items here. They do intersect in that they both are bearish for the next few days, the difference is that the momentum oscillator after a couple more days, if this "tool" stays here, will probably be telling us to look for another upward move.

If we were to have another powerful upward move from here, it is possible the POIV divergence could be nuetralized and higher readings above the recent ones that we are diverging from could be reached. Probably the correct strategy is just to look for shorts with the knowledge that this is not a great setup at this point, but one worth a swing at. Maybe you take smaller size knowing you are trading against a very strong trend here. Usually, these types of setups produce immediate reversals or do not produce them at all. If you look at the next chart you will see the seasonal inversion we had in September.


We had been following the seasonal pattern to a "T" for quite some time here until September saw that huge rally. Now that we have somewhat of an inversion, it is my opinion that the strong seasonal for the fall does not mean as much because the move has already happened. This does not mean we will not continue to rally, but what it does mean is the seasonal influence is now not a consideration until we get back in sync with it. The next chart shows what a projection tool forecasts for the times in the past where we have had big rallies in the face of seasonal down cycles. It is interesting in that it almost is telling is that mother nature will invert again to get us back to where we should have been.


Will this happen? That is why they turn the machines on every day so we can find out. I think in weighing all of this the odds favor the short side of the market right here. Currently I am still short the NAZ from last week and long the VXX. I am also trying to short a couple currencies today but it does not appear at this point these orders will be filled..

Friday, October 01, 2010

PREPONDERANCE OF THE EVIDENCE


I heard this morning that a record number of fund managers are trailing the SP 500 by 500 basis points ( 5% ). That basis point skit always irritates me. Does it really make people think they are smarter than the next person by using this type of jargon to "impress" people? In any event, the discussion went on to say that fund managers are searching for stocks with higher beta's ( correlations with the indexes ).

Your honor I submit this as my final piece of evidence in my case against the PPT. Isn't this suspicious to anyone? These fund managers are no dummies, and have highly technical computerized models to pick these things out, yet they can't even come remotely close to matching the index performance. The reason why this is happening in my opinion, is that this whole move has been manipulated through overnight futures programs. The next morning everyone is playing catch up in the individual stocks to the overnight futures buy programs. How could you ever hope to do that consistently? You can't, and that is being borne out in these numbers. The main reason you can't is because the overnight futures programs create all sorts of gaps between the prior days close and the next days opens. At times they are also gaps completely above the prior days highs. If you are chasing these stocks on the opening, the best you will be ever to do is under perform by those gaps.

I do not have the figures at hand because it would be an incredibly time consuming task to calculate them, but I can assure you that the average change in the day sessions of these stocks, close to open compared to the overall indexes close to the prior close, would show a huge discrepancy in favor of the index close to close. In other words, there has been a much greater movement in the close to the prior days close in the indexes than individual stocks trying to chase that performance, buying on the next days openings instead of the prior days closes. Some of this is the normal way that futures move anyway, so the whole case cannot be constructed based on this. However, if you study this you will see what I am talking about.

With all this in mind, what we need to do next, is disregard all of this! The reason I say that is that we are in an era where the government is manipulating things like never before, and there is absolutely not a single thing any of us can do about it. It is what it is, I just like to pop off about it from time to time to cleanse myself.

At the moment we have a complete dollar wipeout and blowoff going in the currencies upward. When I look at things like the Euro now I do see some buy signals I could have taken but when markets extend this far, taking a one or day continuation entry rarely works as well as it would have in the last few weeks. You cannot tailor your approach to moves like this, because they are the minority of the overall action. If you have the ability to be so flexible that you can trade moves like this as well as the more normal cycles, by all means do it. I personally have a hard time doing that.

The next chart is of the EURO, it is approaching an interesting price zone, Fib fans are probably all over this one.


We are approaching the magic 61.8% retracement zone in this market. It is flying high currently, no doubt about that. Will this zone be a magic stopping point? I have no idea. I tried to trade with these levels many years ago and just never had success doing so. You can see here we plowed right through the first two levels so they obviously had no impact. However, this is an area alot of people are watching, so it will be interesting to see if something happens there. Another 100 points or so and we are there, which is 15 minutes of price action nowadays.

Interestingly enough, there is one currency that is lagging this by quite a bit, and as a result, I am trying to short this market today.


This is the Canadian Dollar, and you can see how much different this looks than the other currencies here. We have not rallied much of the recent lows, you can see where my order is resting for today. This is not very likely to get filled, but you never know. I will try to short it again next Monday.

That is it for today, all I really have going is the short positions I posted yesterday and long the VXX.