DISCLAIMER

PLEASE READ THE DISCLAIMER AT THE BOTTOM OF THIS PAGE WHICH APPLIES TO ALL CONTENT IN THIS BLOG AS WELL AS ANY OTHER MATERIAL FROM WE ARE FUTURES TRADERS LLC. READING ANY CONTENT BELOW CONSTITUTES AN AGREEMENT BY ALL READERS THAT THEY HAVE READ AND AGREE TO ALL THAT IS SET FORTH IN THE DISCLAIMER AT THE BOTTOM OF THIS PAGE.


Monday, May 30, 2011

IT IS NOT IN THE DATA


I heard what was probably the best response I have heard yet from a prominent Fund Manager when asked the question about whether people should put their money into Gold right now. The dialogue was along the lines of the inflation we are getting into now that the Government is telling is does not exist. His answer was that if you are seeking out Gold as a hedge against inflation, not to do so for that reason. He cited the 20 year period from 1982 to 2002 where we had steady 4% inflation and yet Gold dropped by almost 70% during that time. His summary was that the relationship is not in the data. There might be other reasons as to why someone might want to buy Gold, but his answer was not to do it for that reason. He said TIPS were far and away the best place to go for safety from inflation. These are consistent with the points I have been making about his now for 2 years. Make no mistake about it, the current uptrend is probably the greatest up trend of all time in any market, but inflation has not been driving it.

The one danger that I see with TIPS is that the government is playing with the numbers, so something indexed on government reporting that is fraudulent is not likely to be too safe either. If we get the June top in stocks that is being forecast by some, the commodities markets will crash, so that will save that argument for another time. We may or may not get that top, it is yet to be determined. I had said last week that I was looking for a dollar decline, currency rally and stock rally. We have gotten all of those, so for the moment there is no top in sight.

The QQQ trade I had legged into last week was exited on the close Friday for a decent gain.


I bought 2 units on the close 2 days in a row into weakness and exited on strength. The way the night session is going tonight I wish I had held them, but the rules dictated and exit so I did so, onward.

The END OF QE2

Does anyone really believe this is truly going to end?

They have engineered the greatest stock rally of all time with this program and it's predecessor. Millions of people have gotten completely whole and then some in their retirement accounts. Our "recovery" seems to be slipping some based on some recent economic numbers if you can believe any of them. Why in the world would they risk letting this all come undone?

I do not think they will.

The PPT has been operating behind the scenes for years so there is no reason why they cannot ramp that type of stuff back up, when the "transparent" manipulation is discontinued. We will need to watch for the suspicious buy programs that come out of the blue especially when the market is on the verge of tipping over. If we start seeing that again, we will know they are still at it. It is entirely possible as some have suggested, that Uncle Ben will step away from the mouse and let this thing start to roll over. By doing so the cries for QE3 will come out and he will be able to say I told you so.

Here is the danger in doing that. If they allow the natural forces to start to move this sucker down, they are going to be confronted with volume that will be too big for them to handle. There are alot of big fund people that have their hand on the trigger for exits the minute this thing gets a little weak, and once those orders get triggered, the PPT will not be able to stop things. They simply have to stay in front of this market and I think they are going to try. This month is definitely must see TV, and I am ready if the million dollar short presents itself. I do not know if it will or will not at this point.

I have decided to do a little day trading again, so I will give updates on how that is going. I just decided I have too much money just sitting idle at times and it is the american way to max out your opportunities, so I intend on doing so.

Friday, May 27, 2011

TO BUY OR NOT TO BUY?


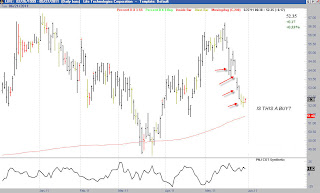
I have been studying this idea now for a week or so, buying into severely oversold conditions when still in an uptrend. If you test out buying stocks at over valued levels when they are above the 200 day moving average and then exiting on some type of strength, this does test out very favorably. The problem of course is that oversold can get more oversold etc.. As you can see on the above chart, we were oversold at the first, second, third, and fourth arrows. How can we ever know when to go after a trade like this?

The answer that is put forth by Larry Connors in his book, who is a great trader, is that you leg into these types of trades. I have been doing one with the Naz that I have been showing in here, the QQQ, just to do one live for all to watch. So far there are 2 units on the trade. If today were to close lower, a third would be added.

Here is the biggest problem with this approach, and it is a BIG ONE. How do you determine position size when trading like this? I have tested out all kinds of different entry techniques in these situations, buying above the high, buying on a limit below, as well as many other ideas. None of them test out better than simply buying on weakness and continuing to do so as the decline continues. On top of that using stops also negatively impacts the results dramatically. The question then remains, if we buy into a sharp decline like this relying on the overall trend to turn it around for us, how do we determine position size? The biggest problem with this is that when there is a trend change, you get clobbered on this approach not using a stop of any kind. It pays off because the winning percentage is very high, so you make constant small amounts, occasionally a big one, then rarely, but they do happen, a big loss.

This is an ongoing project for me, so I do not have the exact answer yet, but my current thinking is along two lines. First, don't take these buys when there is an overall downtrend in the Bernanke's or there appears to be a sell setting up with them. Second, eyeball what you think the max loss per share might be, then back your way into your number of shares that way.

The first is always tricky, because we have had an absolute ton of false sell signals in the indexes. By sell signal here I mean a definitive breakdown type of situation, not a wiggle. I am not saying here that if you see a head and shoulders on a 15 minute ES chart that is a sell, to not take buys in stocks, that would be ludicrous. The second part is a judgement call, as to where you think it could fall to before you know the trend is changed. This is a work in progress, if I come up with anything I think resolves all of this I will let you know.

In the mean time, the QQQ trade I made will be exited on the close today if it stays where it is now for a profit.

On to other business, I have orders in again that are highly unlikely to be filled to short Bonds today below yesterdays low. This is a nice trap pattern if it were to reverse today.


Once again we have potentially if this were to take out yesterday's low, a confirmed trap pattern. It does not appear too likely this will happen but who knows? There was a comment made about Bonds and Stocks both going up and whether or not one of those is wrong. In the old days, buying stocks when Bonds rose was a great thing to do. As much as I do also watch these inter market correlations, it is best to ignore them when determining direction. I think they do need to be considered in position sizing, but often you miss a good move because the correlation slips in and out of it's place while the markets move along.

The most important correlation that is in place now is that of the Es and the DX, the rest I don't think matter too much.

Have a great holiday

Thursday, May 26, 2011

WHAT IS YOUR EDGE?


I talk about so many different things in here that at times we can all get caught up in, "what the hell is he talking about now?"

I posted a table yesterday about the month end bias in May for the stock market. A question was raised about the large portion of the total gain being in one trade. That is a legitimate question, but it completely missed the point. I specifically stated you would not trade off this alone. That is the reason why, most of the net gains were all in one trade. However, the edge in that is knowing that 75% of the time prices moved up, that is what we call an edge. Most things are about 50/50 as far as testing out things, so when you have something that tells you something will happen 75% of the time, that is what we call an edge. That does not mean it happens every time, 25% or one out of 4, it does not.

Which would you rather bet on something that happens 1 out of 4 times or 3 out of 4 times?

I have recently being going through a self analysis to make sure I am focusing on what me edges are in trading and to see if I am doing anything that does not have an edge. The above chart is what I consider to be an edge that I have, but is not quantifiable. There were a few technical things I look at that told me to look to buy Cotton this week. When I went to the chart though, I just felt this was a very marginal bar pattern in the midst of a congestion period, in a downtrend. I determined that it was better not to try and play a breakout out of something like this. That decision was a good one as that trade would have been a loss.

My edge in this area is just being patient, and understanding through experience, that swinging at marginal patterns like this is not going to work out too well over time. This is something that I can do better than most, so I consider that to be an edge. Most mechanical things we do as much as we might think they have this huge advantage, really when you test them out, do not have much of an edge at all. It is sobering, but it is reality. I read all these writings from people about these new technical approaches, and I often take a gander at them. What I inevitably find every single time, is that they are about 50/50. I talked recently about using Fibonacci analysis, which is a perfect example of something that has no edge at all. The edge in using most technical approaches, is how you apply them. For example buying a 10 day low may not show much of a gain net over time, but if you test it during periods where there is a strong up trend, you will find it does have an edge.

It is important to know what your edge is. If you do not have one, find one. If you do, make sure you are using it to your full advantage. Let me give you another example. Last year I was using an oscillator as part of my trading and I thought it had a great edge. When we got into these runaway trends I found out very quickly, it did not at all. It indicated one sell after another that was no good. I stopped using it because it had no edge. I found it was not of value during trends.You have to constantly stay on top of what you are doing to make sure that you are still trading in a way that has an advantage in the markets. Some of them that have been there for decades have been nullified by uncle ben and company.

Make sure that what you are using still has one.

Wednesday, May 25, 2011

THIRD LEG


You can see the above chart of the Q's and where I have legged in to the first and second portions of the position. The plan now becomes to leg in one more third on a down close today if we get it. Once again the whole idea behind this approach is to buy into extreme oversold conditions in up trends. As I stated yesterday, this is not an approach I am completely comfortable with since it is so contra to the way I trade everything else, but the test results from this approach are very good. Testing is one thing, real money is another, so that is why I am doing some of these trades live to get a real life feel for whether I can work with this in ETF trading. I do not know at this point even though the trades I have done have all worked so far, whether or not I can trade like this. Trading with no stops is so contra to how I have traded for so long it is not comfortable to me, but sometimes you have to get out of your comfort zones.

We do have month end coming which in general has upward biases for the Bernanke's, so we do need to be looking for an oversold bounce at the very least here.


This chart shows buying at the end of the month of May and exiting at the beginning of June, and you can see that has been a decent trade over the years in the Bernanke 500. You can't just blindly trade off this but it does tell us there has been a bias historically during the end of May. If we do get this bounce and we may not, it should setup the short of the year in the Bernanke's.

I am taking another shot at Bonds here at the spot displayed on the chart, and I am also taking the ETF TBT equivalent of it if the trade fills.


I am expecting a Dollar decline and a currency rally, I exited my Dollar long trade already. That is it for now.

Peace Out

Tuesday, May 24, 2011

DIDN'T YOUR MAMA TELL YOU NOT TO FIB?


You should have taken your mothers advice if you have strayed into the world of Fibonacci levels. There was a question posed on yesterdays post about my views on Fibonacci levels, so I thought it would be a good topic for today. I have to admit early in my career I studied these at great length and thought there might be something to them. As I lost money time and time again wondering why price did not stop magically at these lines, I never could figure out which one out of the hundred I could draw, might result it price actually stopping there. As you can see in the above chart, every one of these lines is a legitimate Fibonacci level that has not worked during our monster bull market. There must be 50 of them, so 0 for 50 or so? This is not much of a strategy to me. The problem is that at the time you draw in retracement lines to a prior high as in this case, it is clearly the right place to draw them. Then price moves through those levels and you find the next higher spot to draw them. You never know what the hell is going on. The proponents tell you to look for clusters, this makes sense to me. However, look at the clusters above, they are cluster ....s!

The problem with this type of approach is now you have to draw even more lines to finally get one that works. If you draw enough lines on a chart, something is bound to happen around one of them at some point. The question is will you have any money left by the time that happens? There might well have been some retracement levels that worked, I just drew in the resistance levels from the old down trend alone. The screen would be completely illegible if I also put the fibs going the other way in as well. I have always had problems with the bar in space trade. What this means is going in just in the middle of open water in price just because you have some magic number a program generated. At times you can get lucky, but most of the time you will get run over.

Have at it if you will but it is my opinion that these are absolutely of no value at all. There are traders who are successfully who use these, Kevin Haggerty is one I know personally who makes heavy use of these. However, it is his intuitive sense of where the markets are going by looking at many other things that are the key to his success, not his use of these numbers.

They could put me in a straight jacket in a white room and give me a crayon, and I would draw with a crayon between my toes .236, .382, .50, .618, .707, .786, 1.27, 1.44 arghh! Look elsewhere folks, this stuff is a bill of goods being sold by snake oil salesmen. I cannot tell you how many times many many years ago I faded markets at these levels one after another just to see them continue on and stop me out. It is not a useful tool in my opinion. For those of you that can use these and consistently make money with them, my hat is off to you, you are better traders than I am.

The next chart is a live experiment with the concept of buying into weakness in trends and scaling in as the market gets weaker. This is a way I traded many many years ago with futures. I used to also require that open interest be declining when the pullback in price occurred. I would then go long the first high that broke. Larry Connors wrote a book describing a few ways of doing this, so I will not get into the actual mechanics of how to do it so as not to infringe on his writings. However, the idea is just buying more and more as price declines. You then exit quickly when the rebound happens and indicators get to short term over bought levels. In this case, the first unit of the Q's was bought yesterday, with a second unit coming if today closes lower. If we rally today enough to get indicators into the over bought zones, the first unit is exited. You can get 80% winners doing this, it can be proven statistically. The problem of course is the losses are doozies because you do not use stops. There is I am sure a Fibonacci number in there somewhere where I bought the first unit yesterday, so maybe it will work?

Since I am expecting an equity bounce to start within a day or so I thought this might be fun to do one of these trades with real daniero at stake. I have done a few recently that have all made money, but this is one I am posting live so we can live or die with it together.


This is an interesting way to trade I have to admit, and I am not totally comfortable with this since I typically like to trade with short term momentum and this trades completely against it. However, I am not closed minded so anything is worth considering in my view, so let's roll. Larry Connors has all kinds of strategies built around this general idea. Visit them at Trading Markets.com if you are interested in learning more about that approach.

The next chart is that of Bonds. I am looking for sell signals again after that boneheaded swing I took at them the other day. We still have a good up trend in place, so until that trend line breaks, I am not sure it is worth trying to short this yet, but I am lurking on this one.


That is all I have for today. I am looking for equities to weaken throughout the day and close low. However, I am looking for a move up starting any day here into the beginning of June, which could be our shorting spot. I have no idea if that is going to play out, but it is what my studies over the weekend told me to look for.

Good Trading to all


Monday, May 23, 2011

DON'T START WAVING TO THE CROWD JUST YET


We appear to be having a breakout in the Dollar Index this morning, but don't get caught counting your shillings yet. This market is still in a weekly downtrend and we are right into resistance right here. We also have some potential divergences being setup against the high we just broke out past intraday.  In my studies of this and the other currencies and the Bernanke's this past weekend, I determined a couple of things. First, in the immediate future meaning today, a breakout in either direction in the DX was a legit trade. Had we gone way down, and we may still you just never know, it was a legitimate short. Had we gone up like we appear to be doing so far, it confirmed the long entry on Friday. This is just based on the indicators I use to confirm trades. We basically had a breakout scenario to go with either way. This also seemed to be the case in many individual currencies as well as the index itself.

What I also found interesting though is that the Bernanke's appear to be setup to have a nice rally after a decline of a day or two. When I run both the pattern mapping software and the software that projects based on how the indicators look, they both tell me the same thing, down for a couple of days, then up. I have mentioned Larry Connors and his book about ETF trading, his approach is saying to buy into the Q's and SPY's right here on this decline. I may or may not dink around with that today, I have not decided yet. Technically the close on Friday in the Q's was the first buy in on that trade, and you buy more as we decline while still in an uptrend. I generally like to trade with momentum and that theory is the opposite, so I struggle with doing it even though it is a very accurate way to trade.

The next chart is that of the dumb ass Bond trade I took last week against the trend. As I indicated on the chart, I had thought that high made last week was a trap pattern, so when it reversed the next day I got short where the red arrow is. After we went straight down and rallied all the way back, I knew I had big trouble and had made a blunder on that trade. It was immediately on the death pool list, so when it continued back up I exited. The arrow on the chart shows the worst exit I did, I got out of most losing 10 ticks, and 12502. I still think this is a sell here and am now looking for a lower short term high to form before going back in. If it forms today and the low goes tomorrow, I will go back in again. I was a bit too aggressive with this first entry.


The last chart here is that of Sugar. We are obviously in a big down trend here, but based on a weekly chart we are seeing some reasons to look for a long side entry down here. The daily trend needs to reverse first, which has not happened yet. I have indicated where I think a possible daily trend reversal might occur tomorrow. This is a trade I am considering.


This long is still against a very strong trend, so the setup has to be perfect to do it and I have not yet decided completely on this one yet.

One comment to make on the overall market here. Many years ago one of my mentors Kevin Haggerty harped on me to constantly watch market internals, he called them market dynamics. These consisted of Trin, Tick, Advance/Decline ratios etc.. He was always getting his quick reads from watching these change dynamically during the day. I had always found that except for Ticks, most changed right with the index direction change, so I was never able to get an advance read on anything with them. However, if you watch the advance/decline line on the daily chart, there are divergences you can find that are meaningful.  They do give us a broader read on what is happening, and right now some of these things are telling us that we should be buying this dip.

Every time I listen to that idiot Barry start popping off I want to just short everything across the board because I think he is going to ruin the world eventually, but sometimes you have to tune that stuff out and look at what is in front of you. I think we will get a reasonable advance warning of when what he is doing is presenting the greatest short in history, by watching some of the market internals and indicators we all use. The million dollar trade coming is on the short side, but I still am not sure exactly when it is going to arrive. My best guess is in June some time but we will have to see. Once it arrives and I catch it I will thank the day he was elected, but until then I still dread that day this was not a good time in our history to have such an amateur at the helm.

I hope they keep spending and spending, it will make the shorts that much better.

Friday, May 20, 2011

TIME FOR ME TO FLY?


Before the day where music became some dude grabbing has balls, talking about bitches and hoe's and F this and F that, there was a band called REO Speedwagon. My favorite song of theirs is TIME FOR ME TO FLY. I wonder if the Dollar Index might be saying that to itself right now. We are at a critical spot now in that we are right into weekly resistance once again. If this market breaks out from this pattern upward, we are going to roll here. If it does not I guess we get another rollover back down. You can see now that my goofy little indicator is moving into the buy zone now. This type of look in this indicator is a better gauge of what might happen than when it goes into the opposite zone on the first bar of a contra move.

The next chart shows similar looks to this and what has happened on average, which does not really support this trade. However, this charts the average, when I look at individual occurrences that comprise this average, it is a mixed bag, some go up alot some down.


The last way to cheat I have is displayed on the next chart. This is a program that matches just bar patterns, and it basically gives us the same look, drifting lower.


It seems as though for the most part these other tools do not support this trade. However, they are computer analysis and trading is done by people, at least for now. It may well be that these patterns will correctly predict the future. I can tell you this though, when I first came across these tools I used them to filter trades and missed some very big ones where it was wrong. I certainly would prefer them to confirm my direction, but it is not a mandate.

Here is another way of looking at patterns and projecting what might happen. This is a proprietary tool, so I have "whited out" what it is. Larry Williams students will recognize what this is, it is one of his tools. When we look at this with the rising momentum and a pullback against it, we are seeing a possible buy signal. Capturing that and looking forward, we see a more bullish projection. The trick with these things is that you can load up indicators and project with them until you get the look you want to support what you are doing. I don't know how valuable this tool is at this point other than it helps find prior occurrences to look at vs having to take hours scrolling charts to look for them.


Net net here, I have the orders in you see on the chart to enter this trade since I think it is worth a swing. We will see afterwards in the post mortem whether or not these tools were right or not.


Thursday, May 19, 2011


DID YOU READ MY FINAL WORDS?


At the end of yesterday's post I mentioned we should be looking for a short in Bonds and as you can see above I took a trade there yesterday. I am not a big fan of going against trends like this but on a weekly basis this is more of a retracement in a downtrend that the commercials have been selling. As a result, when we got the false breakout to new highs that reversed immediately, I thought it was worth a swing.

You can see a problem with my little experimental indicator at the bottom that I have mentioned in the past. At times it shifts into the opposite mode just on one bar against the current trend. I don't like that aspect of this thing, and would not likely go long in a situation like that after just one bar. Of course there are exceptions, but generally speaking I would not. I have not spent much time messing around with this lately so it is not improved any from when I first showed it. Maybe this is just what it is and I have to live with it.

We will just have to watch here and see if this is just a very short term trap reaction or something bigger. It is unknown at this point, it is just another trade, ho hum. I like to take ETF trades along with these but as is typical, this thing is already out of the barn and the ETF is going to gap hence be way late so it will be a pass.

Next, the DX. I am just not sure on this here. My plan has been to buy over in the area we are in generally, and I still might, but the pattern that we are now tracing out if more of one that appears we might get more of a decline.


You can see my indicator is acting more normally here climbing up gradually into a buy zone. It does appear the currencies might be setting up sells in a day or two, so this all could fit together, but the next chart is what bothers me about this. I went back and found the prior rallies like this that went up sharply in downtrends, and then what on average happened afterwards. You can see we worked lower for about another week.


Since we are now up into weekly resistance, I want a really defined buy signal to go against the weekly trend and get long. I do not see it yet. I might just play the individual currencies instead, the patterns in some of them appear to be setting up sells a bit better than this looks like a buy. I do not like trading when I am not sure, it usually does not work out too well.

I had also mentioned I had been buying some ETF's on the decline, since I was looking for a bounce in the Bernanke's. The next chart shows one I did that I just exited. Statistically buying into declines in up trends in equities tests out the best of anything you can do. The problem is where to have the stops which determines position size. No stops bring back by far the best results, but that leaves you with unlimited exposure on the down side which I don't like.


You can see the XLB chart here where I bought on weakness and exited at the close yesterday on strength. I am playing around with this idea, and wanted to put some real money into some trades to do it live. It is a work in progress. I would prefer not to go in and out this quickly, but the current rules I have which are not finalized called for it in this case so I followed them. It was a profit obviously, so a good result, but only .75 per share so not a home run by any means.

Overall I think we continue to work higher in most things today. It does appear that we are setting up nicely for a June high in alot of markets, but it is always possible the PPT will figure out a back door way to continue pushing all of this beyond that date. We will have to see when we get there.


Wednesday, May 18, 2011

WHAT HAPPENS WHEN I MAKE A BAD TRADE?


I mentioned yesterday that I shorted the Yen, and here is the embarrassing result of that trade. I will show you the logic I used to exit this and take a small profit, which is a ....up on my part. I say that because with the logic I will show you, I never should have done the trade to begin with.

I was not too sure about this one from the get go, a sign I should have never done it to begin with. I went into Genesis to find prior patterns that I thought were similar to see if there was anything I could find to address my gut feeling the trade was a pass. The next chart shows the overall projection it brought back.


Obviously this is a very bullish projection, but even though these are uncanny a good portion of the time, they do miss as well. I can't pass just because I see this, I have to go study the individual occurrences it used in the calculation to see what best matches what is currently going on. When I did that I found that the next chart was the best fit.


You can see here that this is pretty similar to the current chart pattern. Once I saw this I decided to take the trade. You can see though that in reality, in this prior occurrence we just had one good bar, then it chopped for more than a week. That is not the type of trade I am looking for. When I saw the big overnight down bar that started retracing, I reasoned that we had the one large range move already and now we were going into a sideways move which was like the above chart. Once I concluded that I took the 50 points I had in profit at the time. I usually do not watch intraday, but due to this above logic, I was looking to see if any trouble was developing. I should not have done this trade in the first place, but I just give it straight up what I am doing in here, so there it is.

It is my view now that we are in bounce mode in most places here for the next few days, so longs should be the plays in most markets not shorts. If we do bounce then we can determine at that time whether or not the bounces are looking like retracement sells against new trends, or the first leg back up of up trends again.

The moral of the story here is, if you make a mistake, don't wait for it to burn you just get out and regroup. There is always another trade somewhere. If after exiting the trade goes on to be a winner without you so what. I find that for me I do the best when I just seek out my core setups, and stay clear of the marginal ones. I was lucky with this one in the Yen, but that gives me no solace. It was a dumb trade to me regardless of whether it winds up going down or not from here.

I do think we have to be watching Bonds closely up here now for a short entry.

Tuesday, May 17, 2011

DEEP POCKETS


There was a comment posted yesterday about the Fed and whether or not they have admitted they are actually buying futures contracts or not. Since I have recently been picking up quite a few new readers I will revisit my logic from old posts that are a needle in a haystack to find. It would be easier if I titled them something less sarcastic I suppose, but that is my style, born a smart ass and I remain one to this day.

For those who have not studied the concept of the PPT and it's workings, you can just google it and find enough to get the general idea. It was formed under Ronald Reagan's watch to ensure stability in times of crisis. The intent was basically to have the group involved stabilize crisis periods with interventions. As to the merits of whether we should be doing this or not, who knows. I am more of a free market guy, so I always say no to drugs like this but drug addicts need help at times. Regardless of whether we agree or not, our opinions are not considered in this process so it really does not matter. The ironic part of all of this, and the brilliance of it at it's conception is the FED is not a government body, hence they do not have to open their books. This enables them to keep their workings secret.

There is pressure building now for them to open up their books to the public, but you all saw how far that went when FOX sued for that and were told to piss off basically. One thing about Barry and his little posse that you almost have to like is that they just do whatever they want, ignore the law and challenge anyone to stop them. It is the ultimate "Scoreboard" attitude. I won so I am going to do what I want etc.. As a result, I have no idea if we will get to see what the FED is doing, but if we do it won't be under his watch.

The COT report is a good way of observing who is doing what out there in terms of positions in the marketplace. In general the Large Specs are the trend drivers who buy on a scale up basis and sell on a scale down basis. You can see that in general on the chart where I marked it off. However, what jumps out off the page on this chart is the completely unusual activity of the Large Specs during the recent market sell off. You can see that they became scale down buyers. If you notice where I have indicated, which is not even the whole run, some or a group of Large Specs lost over $1.5 Trillion dollars when they puked out and sold during the last leg down. It was actually over $2 Trillion by the time the selling ended at the lows.

The rules for classification in this report are basically the Commercials are hedgers, they actually own and produce the commodities themselves. As a result they are given unlimited position size limits to hedge their production with. The Large Specs are funds, and have size limitations. The Small Specs are me and you basically. Now with all this in mind you have to ask yourself who in the world could possibly as a Fund afford to lose $2 Trillion dollars? The answer is pretty obvious in my mind. There were losses reported and Funds that shut down during the decline, but nothing of this magnitude. Here is the other thing I left out just to make this simple, the Large Specs were actually net short almost 50,000 contracts at the highs. This means that they really bought double the amount I stated above, so the real losses were close to 4 Trillion dollars. I just measured the number on the chart from zero to keep it simple.

It is true we have no conclusive proof that the FED or the US Government was this buyer, but if it was not them, who could it possibly have been? Since they are not hedgers, their contracts would have to be covered in the Large Spec category. There is some degree of arbitrage that goes on with the stock indexes now so that could explain "I suppose" some portion of this but it does not change the basic premise. There was some "unkown" buyer trying to stabilize this market to the tune of trillions of dollars as it fell. It is my contention that regardless of what anyone says, this had to be the FED. The only other possibility is that it was a foreign government, but that makes no sense to me at all, does it to you? Why would some other country want to lose trillions stabilizing our stock market? There is not an individual fund or group of them with the amount of money to lose trillions like this. The fact that they ultimately capitulated at the lows means these losses were realized somewhere, yet this somewhere was not reported, hmmmmm.......

I will let new readers do their own research on this. I have stated this just so that everyone has an idea of where this premise I often refer to comes from, and that I am not some loony conspiracy theorist. We do see conspiracies all over the place in life, so they do exist, but they do not explain everything that happens that we do not understand. I do think they explain this, but that is just one man's opinion. As to the daily activities, I think even the biggest doubting Thomas out there has to wonder where these end of the day saves in the futures markets come from, when we go from down 150 to unchanged in the last 30 minutes of a trading session. Some clearly are just natural market forces playing out, but when we see this many of these take place, there is nothing natural at all about that.

Meanwhile back at the ranch, we do have a sell off playing out quietly here. It appears I made a blunder in exiting my shorts in the Bernanke's too soon. Thinking will just kill you in the markets sometimes. I looked at a projection from my software program showing no matter how I ran it a sharp rally over the next 2 weeks. I also looked at my indicators and saw they were turning up it appeared, so I exited on weakness booking some profits. However, I missed the bigger part of the move. Logic can kill you trading. Such is life. However, it was a decision I made and had I still been in my stop would be above yesterday's high. If that were to be hit, it would be a higher price than where I actually did exit and my decision would be validated. No matter, it is over regardless, time to move on.

I have tried buying into this a bit on weakness in a few ETF's just to experiment with this idea of buying weakness above the 200 day moving average. I will show the trades once they are done. The problem I always have with doing this is not trading with any stops and legging in on weakness. On a percentage basis it is very high win to loss ratio trading, but there are large hits you take. I am still working on how to balance it out and do not have any answers yet.


Here is a short I put on in the Japanese Yen last night. Basically we had a trend break with the Commercials displayed selling the recent rally against the recent highs. It has already bounced quite a bit so maybe the trade sucks, we shall see. In the mean time I am still looking for the Bernanke's to stabilize here and bounce for a couple of weeks based on the projection I showed yesterday.

Good trading to everyone


Monday, May 16, 2011

THE STARS ARE LINING UP


Here is something that was sent to me in an email that graphically shows the complete carefree attitude at hand on wall street right now. Notice how we are now in the same zone as we were at the infamous 2007 top. There has been one thing after another lining up that is telling us to lookout below. Of course in the era of the Fed controlled market none of the prior ominous developments resulted in anything happening at all. However, now that we have these levels of risk at hand, it feels like good ole' America once again. Just let er rip and blame someone else when your lack of caution burns you. As long as Barry is there he may even steal the money from the wealthy people to reimburse average Joe's when this thing implodes.

The above chart is not a timing tool, but it does tell us we are in a danger zone. Let's face it this whole thing would have tipped over a long time ago had Uncle Ben not become an S&P 500 futures day trader with unlimited position size rules. The saves they have made have been incredible, and I think they are about to make their last one. Since we are supposedly going to see the end of QE in June, the next market projection is very interesting to me. It has nothing at all to do with the government manipulation, it is based on indicators.


I have cut off this screen because there are proprietary indicators I will not expose in this blog that generated this forecast. It is very bullish for the next couple of weeks. After this up move, I think problems are going to develop. Maybe we will not even move up at all. This has been the hardest stock market to predict that I have ever seen, so I may be dead wrong on this forecast. At times this software is incredibly accurate and at other times it is way off, so it is not enough to trade on stand alone. However, it does indicate that the things I look at are turning up even if we close down tomorrow. As a result, I have gone flat everything I was short on the Sunday night down moves. It is not correct to focus on the magnitude of this up move, just the direction. It is pretty definitive to the up side. Ironically so is the DX. Since we know these two 
move opposite one another in recent times, it is contradictory information.

There was a question in another post about why I say the stocks move the dollar and not the other way around which is the popular view. All you have to do is watch a 5 minute chart, the ES moves first, then the currencies follow. This has been consistent for months now. The currencies never move first, it is always the stock indexes. This makes perfect sense because that is what the Fed is manipulating the SP 500 futures, and indirectly as a by product, the dollar.


You can see in the 3 instances I have labeled in the above 5 minute chart, how the Sp 500 futures move first, then the Dollar follows. It is just a matter of a few minutes, but this relationship has been consistent. In my opinion this is the one thing the Fed has done that is smart. We know they really want to devalue to dollar but if their trading transactions ever get exposed it will show that they were trading the stock indexes and not the dollar. The good ole' plausible deniability skit is in play. "Oh we did not know it would devalue the dollar... etc  " " We just acted to support the stock market at a time when the general public really needed our help." "We headed off the second great depression" Yada Yada Yada.

The bottom line is that they have gotten done what they wanted thus far except for that small little detail, big inflation. Only they know for sure if they will pull the plug in June. If they do, it is beginning to line up as a must do trade, even though it is the most obvious trade of all time, to get short with everything you have. The metals have been the most crowded trade in the history of the markets for a couple of years now and continued to work, so that does not mean just because it is an obvious trade you don't do it. We are seeing in Silver what always eventually happens to these crowded trades, but look at the incredible run that market has had. Even if you are stopped out now or are about to be, you could have made a kings ransom holding this trade for the last few years.

I am hoping the VIX will tip us off come next month as to when the exact day is to short this sucker. The VIX needs to take out 14.27 for us to really be in business on the short sale bet the farm trade. We still have a couple of weeks it appears but who knows. We are on fumes big time right here now.

Friday, May 13, 2011

SAME OLE LANG SYNE


Blogger was down for hours this morning so that is why this is posting so late.

Once again we are in a mode where over leverage is showing it's ugly head for umpteenth time. When I see moves like what we saw in Silver it is only a matter of time before the stories start coming out about people pressing their bets too hard at the wrong time and getting wiped out. Several prominent hedge funds have taken massive losses during the recent Silver collapse. I always find it ironic the term hedge fund. Hedge implies that you are diminishing your risk by doing something else. These hedge funds are nothing of the sort, they go balls out one trade after another, and although there are some exceptions, many ultimately are nothing more that river boat gamblers you just put all their chips in one time too many.


I can understand that when you are long during a big run like we have had, that when a pullback happens you have a draw down, but not $500 Million like some of these guys have had. They had to be scale in buying all the way up, and this movie has the same ending every damn time. How anyone with any trading experience at all could look at that price run in Silver and continue buying into it is beyond me. Now is when you should be adding to your position if you are a long term bull, on a sharp pullback. Momentum trading is very dangerous when markets get extended like this.


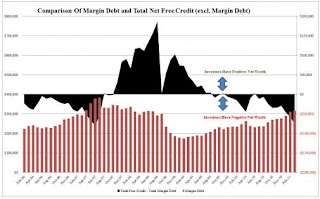
There is also now apparently an excessively high margin level going on collectively at US brokerage firms to similar levels to when we have had big stock market declines in the past. It is really unknown what our chairman will do in June, but it appears there is some big money betting he is pulling the chair so to speak. If he does and they just let natural market forces drive price, we are going to see quite a decline across the board. I don't think the FED wanted the huge run ups in commodities other than the metals, and of course they wanted stocks to rise and the dollar to fall. They always want to be inflating a bubble somewhere artificially to give folks a place to move money to. Then when the bubble pops they inflate another so people can chase their tails into the new bubble and on and on we go. Our great leader Greenspan wrote this play and directed it for years before syndicating the rights to it to the new kids on the block. They are just following the script or playbook that won the Super Bowl.


I have not done much trading this week and I will explain why. We are still in the "if the ES moves down 5 points so does everything else" mode. This means the world is one trade again. If we accept this premise and I do not know how anyone could not accept it, then we have to be looking for sell signals in the indexes if we want to short anything else.


You can see that just recently we had what I consider to be a pretty similar triangle type pattern as to what we have now. In that case we meandered about for a bit before finally giving way. We had one false breakdown of the pattern first, similar to what happened this week. The Bernankes ( the stock indexes ) have had many types of setups like this over the past couple of years, almost all of which have just launched higher, so even though I do have some things I use that say to sell here, I have been treading lightly. I do have sell orders for today under the market at levels that I seriously doubt will be reached, but in case we rollover here I wanted to have something there. I do not think they will be filled. If we do move down then I think there is a green light to sell other markets also. Until that type of thing occurs I would rather sit still than get smoked in another short sale trap. I have shorted a couple of currencies including the Canadian Dollar and Pound which I showed the setup of the other day. However, I have kept it light.

The other problem we have going on here is that the ranges in some markets are so big that the stops to take the trades are just not prudent risk management. As tempting as it is to get fired up about all the money you can make right now be aware that these are periods where hedge funds implode, not prosper. This makes for treacherous swings in prices.


Since the DX is being controlled by stocks, it is no surprise that we see indecisiveness there as well. If you recall a couple of weeks ago I put up a chart that showed at the time the sudden huge spike in Small Spec longs. I also showed that the prior times that had happened we made a new low then bounced. You can see that is exactly what has happened here. I have not gone long this market yet, but as I have stated above I am short some currencies so that is the same trade basically.


A long in this market will also require a stock decline to work in all likelihood.


I came across an email this morning from someone telling me about a convention where there is now a new way to look at commodities. Of course I needed to read no further before thinking sell, sell, sell. This reminds me so much of the "they are not making any more land" argument the real estate people were making back in 2005. If you take the time to sit back and think rationally about things, it is amazing how simple it is to frame the right approach to all of this. Of course there is no new way to look at commodities, please..... That is obviously a major top type of signal when we hear things like that coming from commodity producers.


It it just the same Ole Crap over and over isn't it?

Thursday, May 12, 2011

Please check back mid day I have plenty to talk about here, I am tied up in some other business matters so my post yesterday was missed and will be late today.

Tuesday, May 10, 2011

TRIANGULATION


Here we find ourselves in a classic triangle situation. There are lots of takes by various all stars as to which way to play these breakouts. I personally do not trade this pattern at all and the main reason why is that I have never found any consistent approach to determining which way to play the breakout.

The low of 5/5 took out the little pivot low of 4/25 so that tells me that even though on the surface this appears to be just another garden variety pullback in an uptrend, the recent pullback did a tad more damage that is obvious by a quick peek at this reveals. Also, the trend line on the top side is a bit steep to be meaningful to me. You can draw lines on a chart all day long if you wish to and create a map that looks like what Christopher Columbus used, that is otherwise known as Gann theory. I think when you do that, just by pure chance something will happen at some line somewhere. That does not mean that it is something to trade from.

The trend is up obviously, and as of today I do not see any obvious reason to short this market. However, I also do not see a buy signal, so I have nothing to do in the Bernanke Indexes for today. My Oscillator as you can see at the bottom is in the buy zone, so that should tell me to lean to the long side here. I am just not sure here so I am moving on to something else. What is that something else?


Here is the Canadian Dollar one of the weakest currencies. I think this market is setting up for a sell signal. I know even saying the word sell in any market is heresy at this point, but that is what I see here. Maybe I am wrong? It does in general require a down move in stocks for any other market to decline except the dollar and Natural Gas, so it may well be that no sells ever get triggered here. We have many markets across the board that are in sell the rally status now due to the big down moves last week. Were those dips buys?


There was a story out there that a big hedge fund bought a bunch of Silver Friday, and so far that is certainly working out well. Above is what has typically happened when a move down like this happens. Some of the other examples look a bit different, but most feature a basing period or bounce for a few days to a couple of weeks, then another move down. This is why I am waiting to sell the bounce. One thing that I have mentioned over and over is that markets like this create really bad habits, that will come back to bite you if you are not aware of the fact that buying something like this is generally not a good idea. It is a great idea nowadays but when major tops do come and they will at some point in time, those who do this are going to get wiped out. The trick is that we do not know how long this huge uptrend will last. For all we know it could be years and you could make millions doing the wrong thing and have the luxury of pissing it away from a much higher equity position. This would be a good problem to have.

I could put up charts of other markets like Crude, but many of these look the same. I am looking for sells on the rallies here not buying these dips. Maybe we will just sail away once again and I will be left behind, who knows?

Good trading to everyone


Monday, May 09, 2011


WHAT WE CAN LEARN FROM SPORTS


Sports analogies get very old and tiring, but there is something we can learn from watching sports that applies to trading, the concept of Momentum. I mentioned recently in here that the Lakers were an example of a team being hyped constantly by the media and their supporters. I am also a Lakers fan being a San Diego resident. The net chatter was that "oh they will be alright, once the playoffs start they will just turn things on again,etcc." I had made the point and I made it in here, that from watching them closely all year, they were just not any good. They had one lapse after another where it was clear to me they were not lapses. Something had changed with them. As I watched them get rolled by a far superior team over the last week, I was proven correct. My best friend is a General Manger of an NBA team, and even he did not agree with me on my view of the Lakers. He just texted me after Friday's loss saying I was right and he just did not see it.

Does this sound familiar to what is happening with the US Dollar? This market has been in a steady downtrend and it is assumed it will continue to be in one. However, this recent move could be the equivalent of when the Lakers lost to the Cleveland Cavaliers who had barely won a game this year at the time. It was an early warning that something was changing. It did not change right away but change it did. This is also what I think will happen here. If we can equate half an NBA season with a couple of weeks in a financial market for a second, a sideways move to consolidate this bounce would be the equivalent of what happened with the Lakers. They just never regained any consistency even though they had good stretches. So it could be with the Dollar Index here. However, if we just roll right back over again and blow out the lows, then we could view this as an anomaly that means nothing. That would mean team downmove in the Dollar is still rolling and this bounce was a glitch and not the sign of problems.

Sports are microcosms of life because the momentum swings are the result of human emotions. Since there are fewer people the swings happen more frequently, such as during a second half of a game. The markets are comprised of millions of people's emotions, so the swings that happen take longer to play out. The Dollar and the metals are examples of teams who have already been given titles. They have had their celebrations for future championships they have not won yet. We have seen the crack in Silver which although we knew it was going to happen, was impossible to pick to the day. Now we have a big break there and it is very unlikely that those highs will be seen again. If you research huge spikes like that which I displayed a couple of weeks ago, they normally mark decades worth of price highs not just weeks of them.

Watch now for a retracement in the Dollar to get long, and a bounce in the metals to get short. Crude Oil is not quite the same thing, but a close enough cousin to be in a similar spot.

The Soy Complex is also one I have mentioned in here recently that I think is ready to make a move upward. Below is a weekly chart of Soybeans. I have labeled where the Commercial buying has been coming in on this pullback in the uptrend. The daily price action is a mess, so I do not see any long entries setup there yet but this is a market to have on the radar for buys.


The last market I want to cover today is Bonds. We have had a spectacular rally in this market recently, but now we are into an area on a weekly basis where we could run into some trouble. This market is being sold by the big boys on this rally, and we are still in a weekly downtrend. This does tell us if we get daily sell signals we should take them. As it is with Beans, I do not see a sell signal anywhere on the daily chart yet, but another market to keep an eye on.


I am not sure about equities here, I do see some buys here if we rally, but nothing right here for today.

Thursday, May 05, 2011

THE WORLD JUST CHANGED


 The story of the day had to be the meltdown in metals and oil, yet nary a word on it tonight on the news. This is the beauty and the challenge of the COT report. It was telling us that without a doubt a huge selloff was coming in Crude Oil, yet we never know exactly when these things will kick start. Well I would have to say it got kick started today. At one point we were down over $11 a barrel, just incredible volatility. The Silver wipe out has begun, down now 30% off the highs already. What next?

In this wacky world one never knows, but it certainly does appear that we have had big picture trend changes in two very in vogue markets to be long. We also had a monster rally in the dollar today. I have been in here talking about the DX and that I was looking for a rally. I quit probing with my logic I discussed the day I told everyone this. I am waiting for the first pullback trade in that market, there will be one if this is a real trend change beginning here. I sure with I could be a fly on the wall in the meeting that is taking place where they are determining how to alter the NFP report tomorrow. With stocks on eggshells here, I doubt very seriously they are going to release a report that is really negative. It could spurn a big rollover here. Many big stock declines have taken place on Fridays historically. However, we are very short term oversold so we could get a down and big snap back reversal due to that. I passed on a few new stock short setups I had for today just thinking I did not want to get more aggressively short after we had already declined into a short term buy zone. Rallies are being sold at the moment and that is what you have to follow until we get back into declines being bought etc..

None of the things I watch are telling me to buy the Bernanke Indexes here, but I am also aware we are due for a bounce at the very least. Generally the way to play the report is to fade a big initial reaction but I do not trade that way. Overall we have moved down so much in so many places here that the trends have changed and we need to look to short the first bounces.

Here is the Dollar Index, the Fed has to be pissed off about this move. The good news for them is that it is still in a well established downtrend, so this could just be another selling opportunity. I am hoping to get a buy signal somewhere over to the right as I have written on the chart. If it just takes off without me I don't care. I know some readers here got long this market today from some emails I got, so as they say in Canada, "good on you." One day does not a trend make so I am waiting here for what I think will be a better place to get in.

In general although we never know what will happen, it does appear we might be in the process of putting in a commodities top that will be the million dollar trade of the year. The only market I really missed a trade in was Heating Oil, there were sells there I passed on. In the others that turned on a dime, there were no signals in my world. If you remember recently I mentioned that Silver and some of these markets were likely to turn just out of the blue, and this is what we have seen. You cannot just fade fade fade trends like these hoping to catch a top. You will be cleaned out before you hit it. Be content to trade the first retracements it is the higher probability way to trade.

Good luck trading Friday to everyone

MY MY MY


I would love to say I told you so which I did, but I said that a few other times over the last year in this market and this never happened. However, the timing on my recent comments was awfully good in this market. As we watch a futures meltdown take place across the board today we have to keep a few things in mind.

First, I know many of you might be thinking I wish I was short Silver. You can see from the high this has moved over $63,000 a contract already. This is the trillion dollar trade I told you someone with big money was going to catch. However, if you are trading this market right now you are an idiot. Yes I would love to be short here of course. However, this was an impossible trade to catch unless you played it the way I suggested the other day with options. When a market moves this far like this going parabolic, it becomes a complete guess as to where to exit and or short it.

Second, small investors were pushing this move, so you can see how quickly things change when they get trapped. It is what we call the weak money. They get in late and bail fast when trouble starts. As much as I try to fade these guys, in a situation like this it has been impossible. They have been driving this market for a year or more. Watching what they were doing was of no help in timing this even though we knew what was going on.

Third, do not get caught into trying to hone techniques for fading the trends just because you see Crude and Silver crashing. The Crude was very obvious and easy to spot and I called that out here pretty accurately from the COT data. Of course T Boone Pickens was of great help. The minute he starts calling for a big move up it is always time to get short immediately even if it means breaking your ankle to run to your computer to do it.

If you look back at the charts I posted when I talked about his market you can see this is playing out just like the early 80's top. Of course it is. The it's different this time arguments are always exposed after the fact. I saw a prominent metals bull the other day say that Silver could drop 50% and still be in an uptrend. What? How in the world could something decline by half and be considered to be in an up trend? On what time frame, a millennium chart? I suppose if you are a long term player and are convinced of the Doomsday scenario and that Mad Max will want your Silver in exchange for water, a 50% drop is a buy. Ironically we could see that amount of drop in just a couple of weeks time. We have already dropped 26% in just 8 days. The same group also essentially called Soros an idiot for selling his Gold claiming he must be reinvesting it in some other form of metals play. I am no fan of Soros at all due to his anti-American ways, but he is one helluva trader. For someone to say this about him, that he could buy and sell many thousand times over, is just another sign of a top. Does anyone remember when Buffett was being called an idiot by Ron Paul for putting that money into Goldman Sachs?

When a scrub calls out a star on something, trends change, that is the lesson learned here.

Gold has not changed it's daily trend yet. This is more a sign that Silver was just a blow off type of situation. Although Gold is not a buy yet, it appears to be setting up a long side entry here in the next few days.


The problem I see with the Gold long right at the moment is most of my short term things are still going down. I really want them to turn back up before getting involved here. If it does not hold here the game is over here at least for the time being.

The Crude market has rolled over and now appears to be in sell the rally mode.


I have shown Heating Oil because as I have been saying, this was the weak link in this complex and it has broken the most. We need to be looking to sell rallies here if we get them. You can see I have a ledge in price outlined that we broke from. This is a great short term pattern. Wait for one side to have a false break out then when it goes out the other side of the ledge take the trade. If you look through charts you will see alot of these trades work really well.

There are many markets now including the currencies as of today that appear to be beginning trend changes to down. We need to look to sell the bounces pretty much across the board. Remember, the world is still one trade thanks to the evil empire so keep that in mind with risk. Konrad, like you, I do not see any setups jumping off the board at me. I do have some short stock positions that are making some money, but I am flat I hate to say in futures right here.

The last chart for today is that of Copper, this market continues to lead us down.


We do have the NFP report coming tomorrow, but that report is just an absolute joke nowadays. It is so doctored that it is worthless in all honesty. Just ignore the noise and also Mark Zandi telling us how great it is no matter what is in it. I think he would say it was great if it showed the rate at 20%. I would expect it to show a gradual improvement again to be consistent with the BS story they are trying to sell us about how great everything is, but who knows.

Keep your powder dry, we have a potentially good window coming up for some shorts on bouces here.