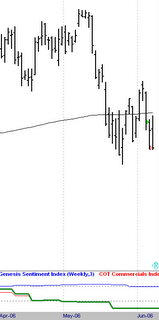
 S&P Trade Follow Up
As you can see from the red carrot, this trade was stopped out for a loss today. I think you could tell that I suspected this was going to be a losing trade. However, since I could not find an objective reason for not taking the trade, I followed the rules absolutely.
One can never know by guessing, when a particular pattern will not work as it has historically. Systematic trading removes this type of doubt and second guessing. I could have easily manufactured a number of reasons supporting my thought, that this setup would fail. However, when you get into that vicious cycle, you never get out of it. You wind up second guessing everything you do. The emotional toll this can take is substantial. By trading systematically, with disciplined money management, all the trades are basically the same.
At times, you just have to stick to your guns, and take the good with the bad. Taking losses is part of trading. If you are not prepared to take losses, than this business is not for you.
One thing that is becoming clear right here is the insignificance of the 200 day moving average as a support point. This is something I have mentioned before, now you can see it actually playing out live. There is no magic to this line.
2 comments:
Thanks for posting your live trades. If you didn't lose, I would wonder about you...
Zeal is suggesting to buy gold when it gets to its 200dma. They say that's a support position. I never understood that. What magic hand holds prices at that level? What magnet draws them there?
Thanks. I did find something that has improved that pattern in the S&P that is a fundamental item. It will improve that pattern's results in the future.
The 200 day is watched by institutions, and as a result if is widely written about. However, I have researched it, and found virtually no correlation to support in prices and the 200 day moving average.
The old saying goes something like this "if you draw enough lines on a page, the price will stop at one of them." WD Gann is a famous trader, and if you every saw one of his charts it looks like an etch a sketch!
How anyone could make a decision from all those lines is beyond me.
Post a Comment