DISCLAIMER

PLEASE READ THE DISCLAIMER AT THE BOTTOM OF THIS PAGE WHICH APPLIES TO ALL CONTENT IN THIS BLOG AS WELL AS ANY OTHER MATERIAL FROM WE ARE FUTURES TRADERS LLC. READING ANY CONTENT BELOW CONSTITUTES AN AGREEMENT BY ALL READERS THAT THEY HAVE READ AND AGREE TO ALL THAT IS SET FORTH IN THE DISCLAIMER AT THE BOTTOM OF THIS PAGE.


Thursday, October 26, 2006

GOLD

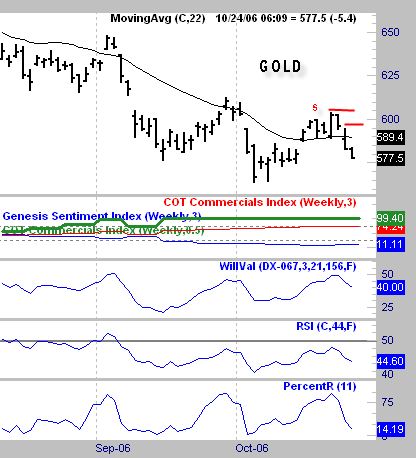
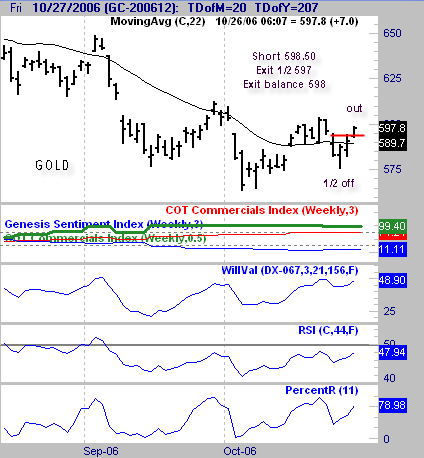
Here is the completion of the gold trade. The remaining contracts were stopped out today at 598 for a .50/ounce gain, essentially just covering the commissions. Remember that more than 1/2 of the contracts were taken of at 597 for a large gain on that portion of the trade.

This is part of money management. When confronted with a large quick gain on a postion, I suggest taking 1/2 or more or your position off for a profit, and stopping the rest at breakeven. This way you have the potential for a windfall on the rest, but are protected in case something like this happens.

NEVER allow a huge gain to become a loss EVER!!!!!!

Tuesday, October 24, 2006

Gold

I pointed out a few days ago when Gold was at 598.50 that it was a short setup. As you can see that trade has a $21/ounce or slightly over $2,000 per contract gain. For anyone who took this trade the stops can be placed at the red lines depending on your level of aggressiveness.

Taking partial profits here would also be prudent if you have multiple contracts. For me the stop is at break even on remaining contracts at this point, $598.

Thursday, October 19, 2006

Time for a little patting on the back - my own

Over to the left is the last update on the Robbins World Cup trading contest which features my bond trading system from the daily trading service offered on my web site.

As you can see, the account being traded there, which features these signals alone, has a nice 46% YTD return. It needs to be stated that the commissions and fees charged in these accounts are much higher than what is normally charged for self directed trading, and represent a drag on the return which brings it down to this level. Most of my other accounts with lower fees have returns in the 55% range due to this differential.

The main reason I have done this was to simply demonstrate out in the open for anyone in the public who wishes to see it, that my trading service does produce profitable trades consistently. I have not traded this to "win" which some of the contestants clearly have. There have been some wild swings in account balances as people have come and gone from this leaderboard. That is too stressful of a way to trade for my taste.

I have used consistent conservative money management to closely mirror what an individual just using prudent risk paramaters could have achieved using this service. There are some of you out there who have traded my service this year that have benefitted nicely from this. I have no idea how any individual might have managed his or her own trades within the signals given. YTD the signals have been 26/34 for 76.4% accuracy and a $5,118 per contract gain.

Tuesday, October 17, 2006

Golden Short Setup

This is not truly Golden it is just a play on words. Here we have a typical retracement against the trend setup. One trend measure that has written about by a few people over the years is just using the RSI and it's absolute value to determine trend.

I discovered this about 10 years ago just playing around with concepts and did use if for short term trading. More recently, Larry Williams has referenced this in his writings. Great minds think alike? Just kidding about that, but he suggests the 44 period setting so we will use that for this discussion.

Above 50 indicates an uptrend and below 50 indicates a down trend. The PercentR is a short term measure of over bought and over sold taught originally by Larry Williams. This tool is part of most software packages for trading. As you can see it indicates an overbought condition in a downtrend, hence a sell opportunity.

Friday, October 13, 2006


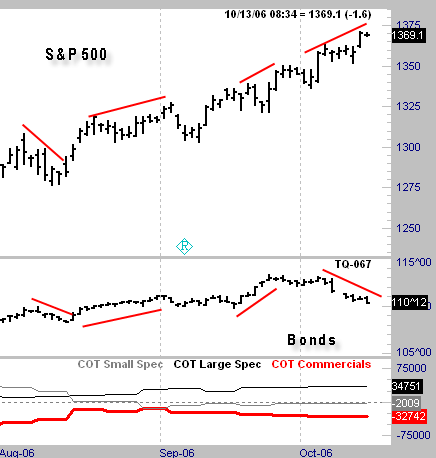
Displayed today is the S&P 500 and the bonds. Notice how all the way up during this big rally, the bonds have supported the S&P in both directions as indicated by the lines on the chart, until recently.

Now that the bonds have broken their uptrend, they are diverging from the S&P. It is early in the game for this to be a big problem, but it bears watching. Sometimes these divergences can carry on for months before anything happens like in May when it finally mattered.

However, in July the bonds started bullishly diverging from the S&P and almost immediately the stock market rallied. So, this is something that at the very least should tell folks to cut back their long exposure to stocks and be prepared to get out if we get a break down in S&P 500 prices.

At this point it is just a caution warning, but this rally is so extended that even the election bias is not going to save it from at the very least a pullback. Figure out your own ways of using this tool, it is worth the research time.

Wednesday, October 11, 2006

BONDS

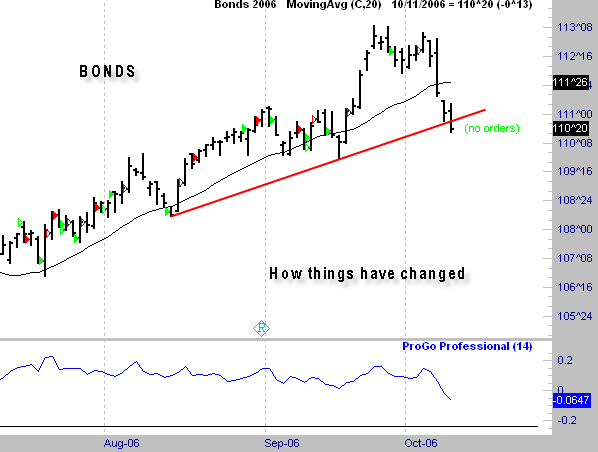
Well things have certainly changed. No matter how we draw the trendline upward it has broken at this point. I had mentioned that I was suspicious of this uptrend but until the trend broke pullbacks were long entries. The reason for that suspiciousness on my part was that we had reached the 2.0 std deviation point at the highs, so we were very extended. This along with the commercials being heavily short were reasons for caution. These influences negated long entries that "might" have generated on the initial drop.

The trend has now broken. It still could be what we call a bear trap meaning this is a sucker move to lure bears in before moving higher, but it certainly does not feel that way. No matter how I test this pattern right here it is bearish. We are getting oversold, so we may get a buy signal here shortly in the trading service.

We do have a strong seasonal bias up for Friday so maybe that will bring a bounce upward, but this market appears to be in some trouble overall at this point. If we continue down, this is going to cause some problems for the stock market. So far we are only at 15 day lows, but if we get to 30 day lows it will be trouble in river city.


Tuesday, October 10, 2006

BONDS

We are precariously close to the uptrend line in the bond market. So far today, we have a gap down that has not been filled. Over time gap down bars are not good setup bars for buys the next day, so I will probably be on the sidelines again tommorrow in this market watching.

I feel it is very important for this market to hold right here. This market has helped propel equites as well as keeping a reasonable floor under the housing market. This certainly appears at this point to be more than just a pullback especially with the commercials heavily short, but technically it is still holding on but by a thread.

Friday, October 06, 2006


Bonds Living Dangerously?

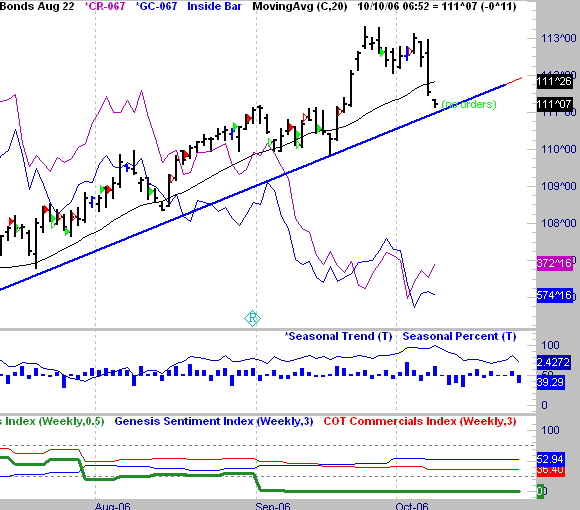
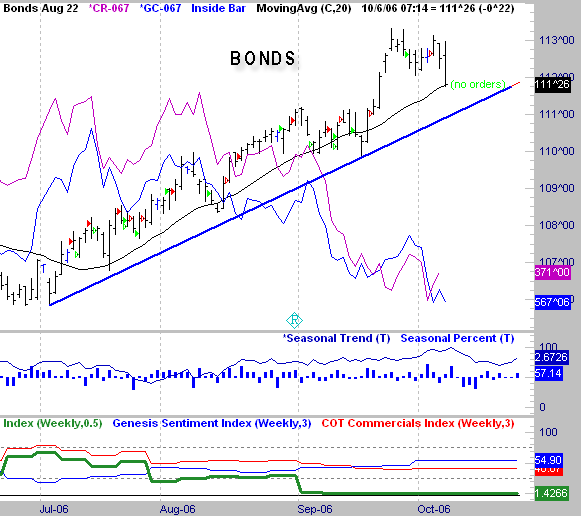
Here is a daily chart of Bonds and the retracement that is taking place. The blue line marks the uptrend, which is still intact. This could just be a normal pullback and my system will probably have buy signals for Monday after today if we close here. I really wanted to short this market today last night, but the pattern just did not line up well enough. When in doubt, I stand aside.

However, for the gloom and doomers out there, if we break this uptrend that will be trouble for the stock market. Lower rates have driven this rally recently, and if that underpinning is removed I think stock prices will drop off.

You can see that seasonally we are due for a little drop here at the beg of October. This could very easily just setup a nice bull flag for a long entry. Let's hope this uptrend holds. The heavy commercial short position is a fly in the ointment here as you can see at the bottom of the chart. They have been early to the party. It will be interesting to see if the commercials have lightened up their longs in the SP 500 on today's report, I bet they have.

Wednesday, October 04, 2006

Is there trouble brewing in Paradise?

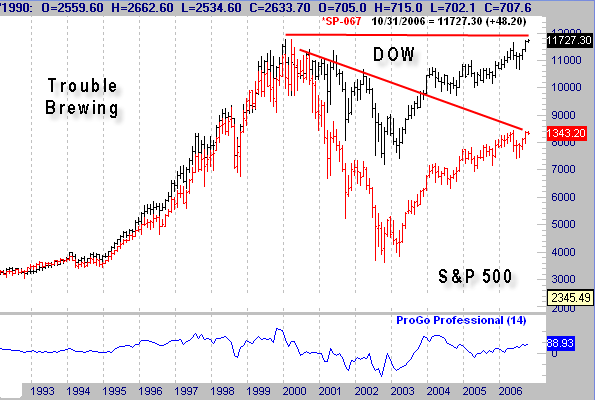
There is a trememdous lag developing between the DOW index and the S&P 500. Notice how we are at new highs on the DOW, yet are quite a ways behind the old highs in the S&P 500.

This is a bearish sign for the indexes. I have been looking for a rally all year and we have finally seen one. I had been expecting it to happen later in the year. Maybe this big divergence means we will see a drop off into the fall setting up the real buy point. Notice how closely correlated all the way up to the 2000 high these two indexes were, which is the relationship that should be in place.

However, with the bond market as strong as it has been, a large selloff is not likely. Hopefully this divergence sets up enough of a drop to give us a good long entry for the rally into the first quarter of next year.

Tuesday, October 03, 2006

GOLD

September 29th I mentioned that strictly from a trading standpoint this was a short sale setup and here would have been the entry this morning. I still feel that the fundamentals are a bit mixed in this market so I did not enter this trade.

I do not trade markets like Gold alot, so I want the perfect setup. For those wishing to trade in and out of this market alot, study this setup because it is a textbook flag/retracement against the trend trade.

You just look for established trends, which we have here and wait for a retracement against it up to a 20 or 30 period moving average. Once that setup is in place, just trade the breaks of the lines of the retracments like this one today. You can add a bunch of other "noise" to help qualify these, but over the years I never found any increased accuracy by doing that. This techinique just keeps you in sync with the overall trend in the market and over time is a profitable way to trade.

The only filter you might want to try is only taking the first 3 retracments. Once you get to 4 or more sometimes the trend is getting a bit tired and is due for a change. Just to reiterate, I do not trade like this, but this is a technique I used successfully earlier in my career. There are many traders that are quite famous that trade in this fashion alone.

Sunday, October 01, 2006

The Buck

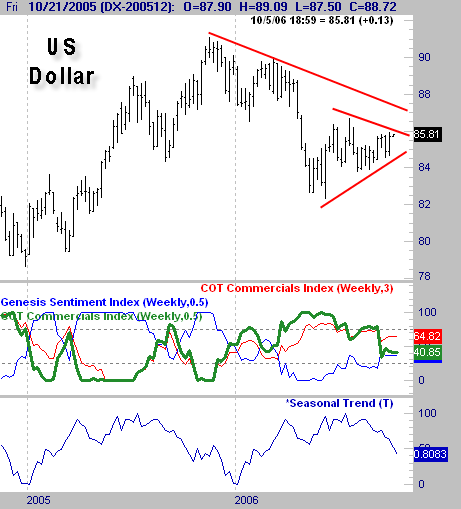
Here is a weekly chart of the US Dollar Index. I read so many articles talking about the doom of the dollar, yet we look at the chart and we are 6% above the low of 2005. Maybe the forecasters are correct, but we are certainly not in a huge freefall at this point.

Admittedly, I am not a gloom and doomer because I just do not buy into these extreme theories in either direction. There are seasonal decline tendencies in this market here, but until we break out of the downside of this triangle, the short term trend is up. Longer term, we are still underneath the trend down off the highs of November, so essentially in a holding pattern right now.

Sometimes when I am confronted with extreme predicitions I try and imagine what the world would be like if they are true. If I can imagine it then I give them some credence. If I cannot then I just brush such theories aside. The huge dollar decline theories are hard for me to imagine in this way for some reason. This does not mean we will not go down, but some of these huge % drops I read that are forecasted seem a bit out of whack to me. The Fed so far seems to be managing the housing slowdown pretty well, so I do not see why they cannot do the same if the dollar begins to drop quickly. In any event, the chart above does not show any immediate danger unless we break down below the recent up trend line.

Friday, September 29, 2006

GOLD

America's favorite commodity recently. It is strange how knowone cared at all about gold until the last few years. This is what a big rally will bring, lot's of hype and discussion.

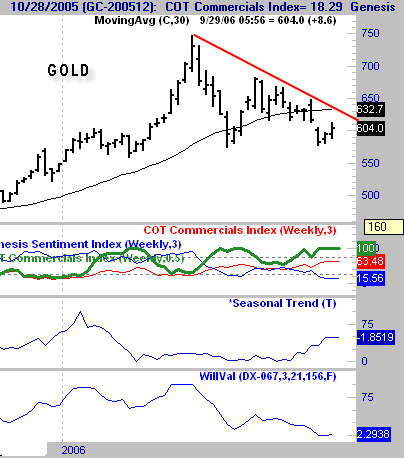
Notice the chart on the left. The 3 fundamentally related indicators, the commercials, the seasonal trend, and it's relative valuation to the dollar all have bullish setups. However, the price is in a bearish flag pattern. We also have calming inflation, which is related to the dollar, and is bearish for GOLD. This valuation indicator on the bottom which measures pure relative valuation of the dollar to gold is an oversold/overbought indicator. So you can see that we can have both a relative oversold reading here indicating a bullish stance, yet along with that declining inflation which is bearish. You can see from the chart that the declining inflation which from my research is the most important driving force for prices in this market, has won this battle so far. No surprise the favorites usually win in life.

From a pure trading perspective this would be a short sale setup just based on the pattern. With all of the fundamentals lined up on the bullish side, I will not short this flag. I am looking either for a breakout above the downtrend line to get long, or the commercials and other fundamentals to shift to the short side during any bounce for a short entry. Once these things line up either way I will be looking for a bar pattern entry to enter this market. The chart pattern here mirrors the fundamental picture here in that it has been indecisive over the last few months.

Wednesday, September 27, 2006

Japanese Yen

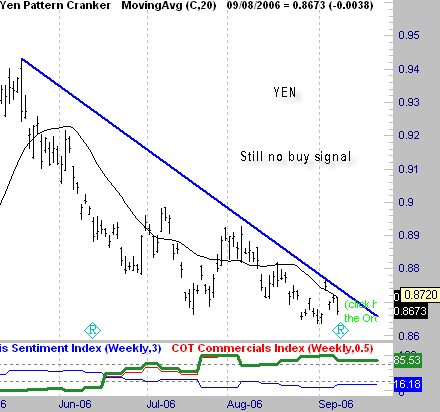
Here is a market that is setup to rally but continues downward. The seasonal tendency is for a rally at this point, and the commercials are heavily long. However, as you can see by the red line drawn on the screen, we are in a strong downtrend.

I have marked a B for buy on the chart above that downtrend line. Any weekly close above this line at this point would be a signal to go long this market. Then if the trend does change to upward we can trade pattern setups along the way.

Until this trendline break, NADA. To quote Tom Petty, "the waiting is the hardest part."

Monday, September 25, 2006

Fighting the Trend

It is a natural human tendency to try and sell high and buy low and in general that is what we want to do as traders. However, we must balance that with not stepping in front of trends.

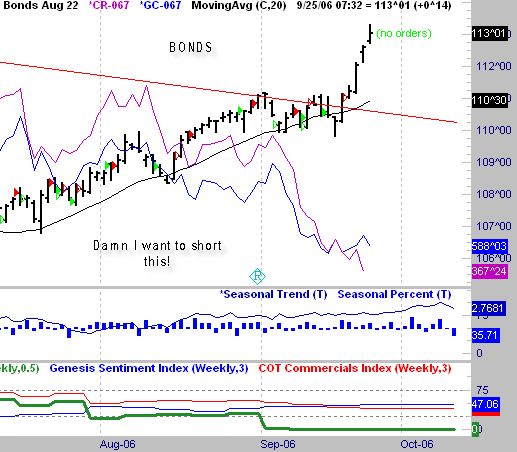
I have been run over enough times fighting trends in my life to itleast understand the danger in doing so. Here we have the bonds is a big uptrend, almost in breakaway mode at this point. I was out with a friend on Saturday who had no idea rates were going down because he has been listening to the media talk about higher rates.

There are a couple of reasons including the heavy short position the commercials have, to look at possibly shorting this market. However, this is a very strong uptrend, so the conditions are really going to have to be ideal for me to do it. I did find a good short pattern for today that had been great except when it occurred after 4 consecutive up closes which is what he had going in. As a result, the trade got nixed. Maybe something will set up for tomorrow, but this trend is very strong.

Friday, September 22, 2006

The mighty S&P

Have we started down yet? Possibly what we are seeing now is the beginning of the downmove so many yours truly included, have been looking for.

Plotted at the bottom is a ratio of the S&P to the Nasdaq Composite. There are pundits out there that will tell you the Naz leads. I think I might argue the opposite, but have not really found a relationship of any consequence either way. I am continuing to study this so maybe I will find something. What this shows at the moment is that the Naz is leading. Yet the Naz is only about half of it's all time reading where the S&P is very close to it's all time high. So, it is hard for me to see how that shows that the NAZ leads.

The red trend line is the key here. We have a very strong bond market which is supportive of stock prices, but these two markets have been known to diverge for periods of time. I was short yesterday and caught a nice short term downmove. However, until we break the red trend line this has to be viewed as just a pullback in an uptrend. My gut tells me otherwise, but the trend is up so that has to be the guide for now. If we get a break of this trendline on a closing basis then more downside should be expected.

Thursday, September 21, 2006

Crude is getting crunched

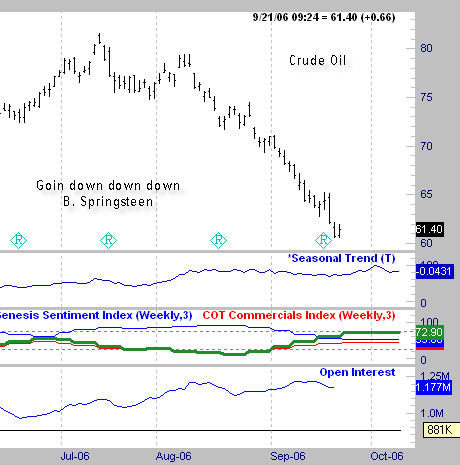
If you go back to the archives and read my post from 8/16 you will see the bearish comments I made about Crude. It was trading at 73.19 at that point.

This is the type of thing that can happen when fundamentals change, the trend changes. I did not predict a major top even though that is what we had, but I pointed out several bearish signs that had developed. You have to stay with the fundamentals and the trend to stay ahead of the game in futures.

The commercials are shifting back in the direction of the long side of the market, but are not yet in a bullish enough position to signal a bottom. Besides the trend is down, so how far we go is anyone's guess. For me it is sell the rallies at this point. Hopefully on any rally against the downtrend we will get a shift in the commercials down back to the short side. It will be pedal to the medal if that setup occurs.

Wednesday, September 20, 2006

Here is the Booming Bond Market

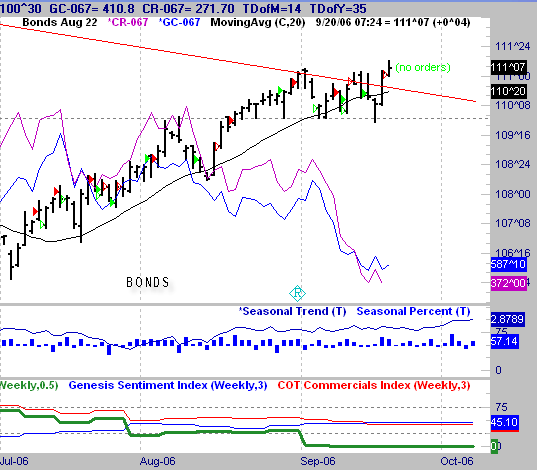
We exited our short term long trade from the service today on the opening for a decent profit, marked on the chart. Just a brief word about systems trading. Today's bar pattern had a very bullish slant to it, and yet we had a profit taking order for the opening. Why exit if the odds are strong on another good up day?

Certainly someone can use this type of discretion in trading and in this case it would have payed off. However, I choose to follow my rules strictly which is of immense help during down periods. There is so much emotion tied to trading that removing as much of it as I can is very helpful to me. This stops all of the second guessing.

We have broken above the red line indicating the larger picture last remaining downtrend line. I still remain skeptical of this rally from a larger view, but for now the short term trend is up and that is all that matters. The trading system has done nicely navigating this market over the last few weeks, so for those of you taking all of the trades you should have been nicely rewarded.

Tuesday, September 19, 2006

Heavy Lumber

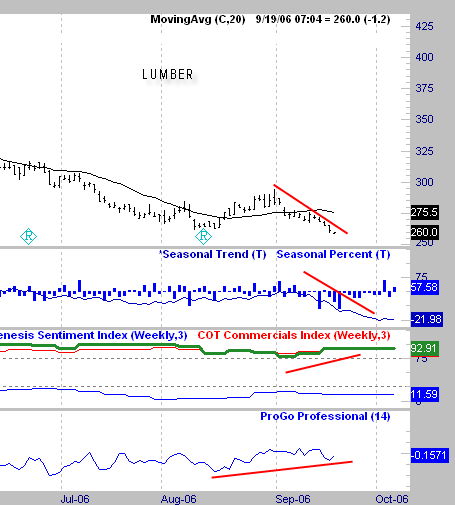
The Lumber Market has been under heavy pressure for quite awhile. The steady downtrend is obvious when looking at this chart. However, this market is setup for a possible trend change. POSSIBLE.

The commercials have become heavy buyers of this market for quite awhile. This is an example of what I have mentioned many times about how they are early at times. The typical seasonal low is in October, so if this downtrend line can be broken in that month it is a breakout that should be taken.

Also notice the strong divergence in the ProGo oscillator at the bottom. I am watching this closely and plan on taking this trade when it comes along.

Sunday, September 17, 2006

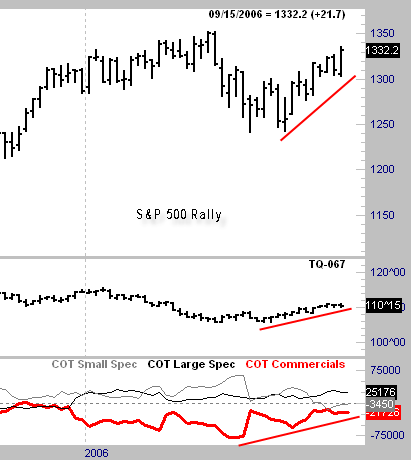
Here we are in the midst of this rally in the S&P in the face of a seemingly questionable economic climate. How can this be? If we keep things simple which is of paramount importance in trading, look at the chart on the left.

Bond prices are rising (rates dropping), and the commercials are increasing their long positions on the rally in price. This does come at a time when typically we see lower stock prices.

Both of the above mentioned conditions are conducive to rallies, and we have the cyclical election rally bias at hand as well. It is yet to be seen whether or not a decline will happen into the OCT/NOV time frame. As long as the bond rally holds, I do not think a big drop will occur. If one does and bonds hold up well, we will have a very good buy setup to take advantage of.

I have not as of yet established a long stock position, so I have missed the boat so far. However, I am content to follow my rules for entry and wait for them to line up properly. I am more concerned about being correct when I enter, than catching every single move in the markets. I do not have any good short term sell patterns at hand, so nada here for the moment.

Friday, September 15, 2006

Golds Moment of Truth

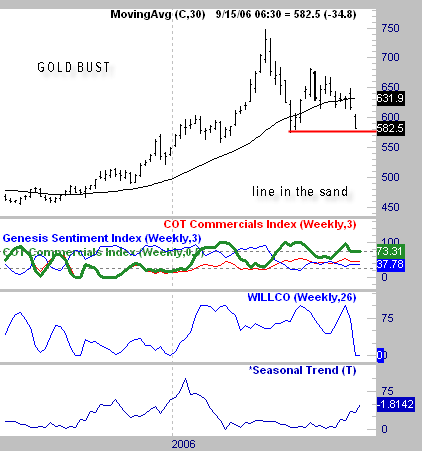
In May I posted current charts of Silver and also the Silver chart from the all time high and asked if anyone thought they looked familiar? They were identical (the correct answer).

Following up with this at a later date, I described a pattern with a large run up followed by a sharp drop, then a rally attempt that fails to make new highs. As "luck" would have it this is exactly what we have gotten. This is a GOLD chart not Silver, but the formation and concepts are the same. In this formation, the low of the sharp drop 574.50 becomes the key support point. This is marked by the red line on the chart.

When these support points get taken out generally a large drop follows. We are very close to that low being taken out here, and if it does get penetrated the game is over in this market. Keep in mind there are no absolutes in trading just tendencies that we need to be aware of to more effectively manage our risk.

For those of us who have watched these types of things painfully punish the chasers over the years, it is clear when people start talking about outlandish price levels like $1300, $1800, $2800 that the top is in. This has not been easy to short by any means and I have not done it. However, I have completely stayed away from the long side mostly due to this big picture pattern that has been forming. Had a strong short term buy pattern setup while the trend was still up, I would have taken it, but nothing did.

Thursday, September 14, 2006

SP 500 Up Up And Away?

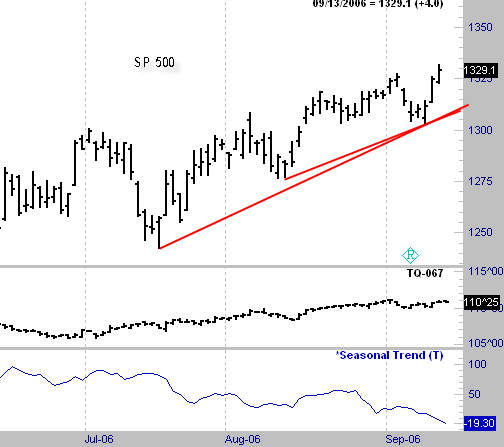
Here we have a SP 500 chart with the uptrend line marked. In spite of what "should" be happening, this shows what is actually taking place. A very solid rally backed by dropping interest rates.

As many of you know I have been looking for a decline into the fall setting up a major buy spot. Will we get it? There is no reason at all to be short this market other than short term trading, until that uptrend line breaks. It comes in today at about 1310.

Before we can get any exictement going about a selloff, we have to break that uptrend line. Until we do the trend is up so be careful about shorting. One of these days we will probably get one of those "shake the tree" days where they break the market hard and the trend changes. However, it is very difficult to fight a trend day after day looking for that one home run. I do not suggest doing it.

Wednesday, September 13, 2006


S&P 500

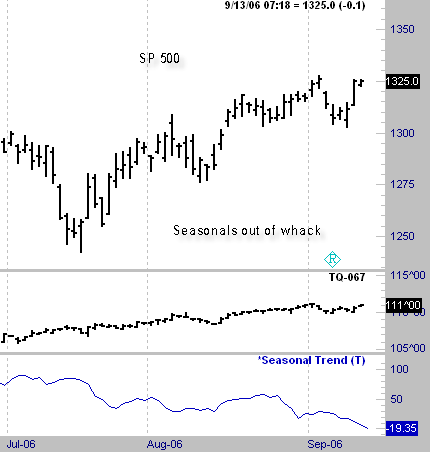
Once again yesterday the seasonal effect failed to have an effect. The fact of the matter at this point is that the seasonal pattern is just not playing out this year. I was aware of it, so I only had 2 contracts on yesterdays day trade compared to the 30 I normally trade. As a result the 5 point loss is barely a normal commission.

This is where some judgement has to come into play with trading. I did it yesterday not by screening a trade completely but through the modificiation of my risk. I know that the day trades to begin with are the least reliable, so already they get half the risk allocated to it that overnight trades do. Next, if we have something so obviously amiss, I reduce the risk further.

The seasonal being completely opposite this year represents that "obviously amiss" category. Maybe we will still get a dip into the fall, but at this point unless that occurs we have to disregard the seasonal pattern, it is out of sync this year so far. I "think" the reason for this is the strong rally in the bond market.

Tuesday, September 12, 2006


S&P 500

Here is a market that is not "behaving." There is a very strong seasonal tendency for this market to be going down but it has a strong rally happening. Further, today is one of the most bearish single days of the year, the 7th trading day of September.

I do have a short position in a day trade that was entered at 1317, which is right about where the price is as I post this. There are a couple of other bearish patterns in place here. An outside bar following and inside bar where the outside bar has a positive close is also a short term bearish pattern.

As a result, my trading system has generated a sell signal to be exited at days end. This is a counter trend trade, so it is not lined up anywhere near perfectly. However, when your method says to sell you sell, when it says to buy you buy. It really needs to be that simple. You take the trades when they favor you and just accept what happens.

Sunday, September 10, 2006

Still Waiting

The yen is a market set up for a buy signal, yet nothing has happened yet that justifies being long. Having worked on this pattern for awhile, it actually shows as a sell signal for tommorrow as long as the open is not less than 8611.

Since the fundamentals indicate a long, and the pattern is a short, I will stand aside. This is part of not fighting the trend, because it is still down. Aggressive traders could still short this based on this pattern, but this trend is a little long in the tooth so the odds of success are diminished.

I will stay on top of this one, and post any long side opportunities that develop in the bar pattern.

Friday, September 08, 2006

Trade Location

I had a few people recently ask about Silver and Gold. Here is a chart of Silver with two possible buy entries marked. As you can see the lower one was clearly the better entry than the higher one. In fact after the second one, the 5th bar after the breakout is actually a very good sell signal, trading back through the gap of the false breakout upwards.

How can we ever know this in advance? The answer is that you cannot. A great trader and friend by the name of Kevin Haggerty once told me that you should always buy at the lowest common denominator, translated, the lowest price setup. He feels that minimizes your risk.

So many people have fallen in love with the concept of diversifying into precious metals, which I feel is due to the media coverage these areas have gotten. One of my replies to someone recently was that Gold is setup better fundamentally to rally, but Silver has a more bullish chart pattern. These are both still true, but there is not a solid entry setup on a short term basis for these markets. Neither one of these markets has a pattern that I would buy here, especially Gold, which has been hit very hard the last couple of days. Silver, short term traders should have been short yesterday about halfway through the day.

Trade Location is of the utmost importance in making profits. Great ideas and bad timing will equal losing money. Make sure and try and take your bigger picture fundamental views and tie them into short term patterns that have the same bias. There are never any guarantees, but this will enhance your odds of success. Just because you think metals prices are going up, do not just run in and buy the futures or stocks blindly. Beware of "Location."

Thursday, September 07, 2006

BONDS

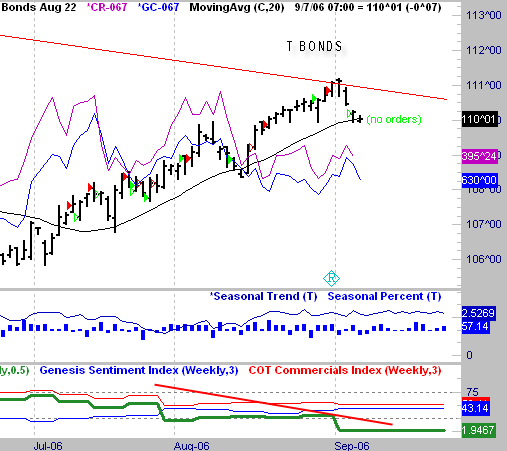
For those who subscribe to my service you are already aware of the selling opportunity I pointed out for BONDS. In this chart you can see that right on cue this market has started to head down. Before patting myself on the back too much I have to admit that I also had mentioned this sell setup the month before. I was early on that call, but timely in this one.

The Trendline drawn in red served as an ideal entry point into this market. I do not believe in drawing a bunch of lines on charts and then claiming that "see I was right it stopped right on this line......etc." However, if there is a clear trend line that can be drawn between two points like this one, it has to be taken into consideration for larger picture views on things.

Also notice down below that the commercials went heavily to the short side recently right as we were kissing this trend line. Our service did get a short trade marked on the chart that made 19 ticks profit. That is a short term trading method that does not ride larger moves. This setup has the potential for a larger move than that, so anyone short from above should just have trailing stops to try and ride this for a bit.

Normally taking half of your position off at an equal point to the intial risk, and then trailing the balance at a break even from your entry price, is a good way of both catching large moves and minimizing risk.

Tuesday, September 05, 2006

Yen and ledge patterns

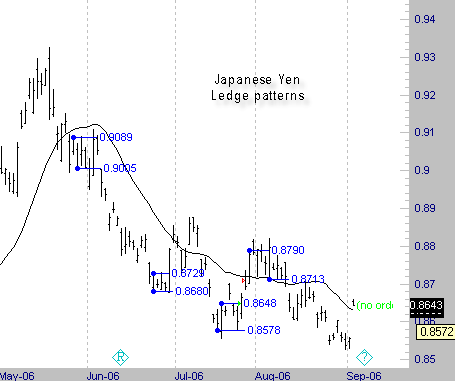
Currency markets are challenging markets to trade due to all of the gaps due to overnight action. One effective technique that can be used is defining these small ledges drawn in on the left and taking breakouts from them.

What we are looking for is matching highs or within a tick or two, and also matching lows within a tick or two. Each of these must be separated by itleast one bar or more. Once the ledge is defined just trades the breakouts. In this market I would suggest not taking the breakouts with big gaps up like today's. Also, trading them in the direction of the trend is preferred.

Some of these work, but the risk increases quite a bit. Also, today's gap is not from a ledge, I just showed it to have a real life look at a large gap as it occurred. This market is poised for a rally so this gap could hold, but a better entry is likely. Ledges work in all markets, but like any technique cannot just be traded blindly.
Crude Oil

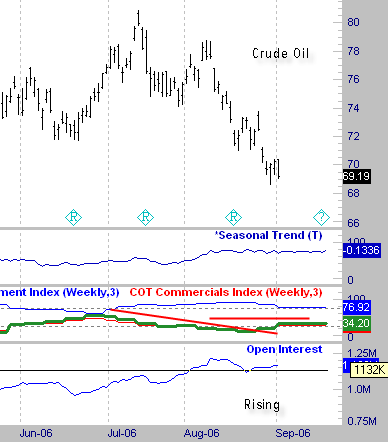
Lewis, here is a current chart of crude in response to our exchange on this market. We are in a downtrend in price and the commercials who had gotten heavily short as marked by the downtrending red line, have moved back to neutral ground.

Open interest is not declining which is what we would want to consider long positions. That is somewhat simplistic and has exceptions, but is the general rule.

So we have a downtrend in price, and really nothing fundamental telling us to buy it, so short the pullbacks until this changes. If you go back to the post from mid August on this market, you can see how we have fallen further from the spot where I pointed out that the commercials were short.

Things do not always follow the script this perfectly, but it is suprising how often they do when you are keyed in on the right fundamentals.

Thursday, August 31, 2006

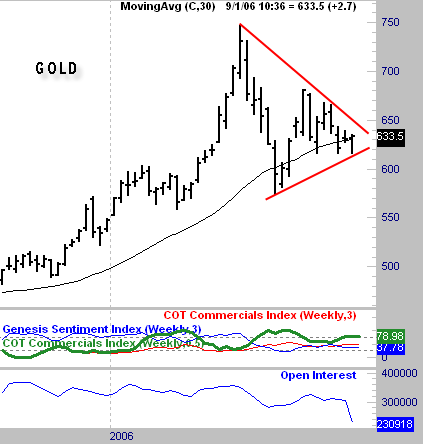
Here is the latest on GOLD

It has formed the infamous triangle on a weekly chart. High level triangles the technicians will tell us are generally a bearish formation, and breaks below the downside of them should be shorted.

At the same time the commercials have been moving to the long side and open interest has been dropping. What this tells us that a larger and larger % of the positions on the long side are commercials.
This is bullish, yet we have a bearish chart pattern.

What to do? At this point I do not see a high probability entry into this market, so for me I will just stand aside and let the economists tell us what will happen here.

Tuesday, August 29, 2006

Profitable Trade

Here is the exit this am in the S&P trade I mentioned in the previous post. The market felt weak this am early so I exited just before the open for 5 point profit/$1250 per contract. This was not a great trade but still was a profit.

This market looks a little heavy to me here, so I am expecting a drop to begin any day now. However, this trade was with the trend so the odds are always in your favor when you are in sync with the larger time frame trend.

Monday, August 28, 2006

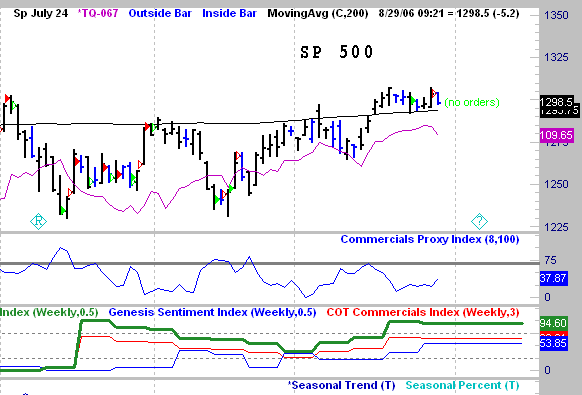
S&P 500 Update

Here is an update on the SP 500 chart I posted the other day. You can see the small b indicating a buy spot in one of my trading systems. I have been long this market the last 3 days. It is in an uptrend and we have had a small breakout of a flag pattern in the direction of the trend.

The Bond market below is supporting the upmove in stocks by being in an uptrend also. I will be exiting this trade tommorrow in all likelihood depending on the opening. If it is a profitable open, it will be exited.

There are a few storm clouds on the horizon potentially which will be covered in my newsletter coming out at the end of the week. There are some divergences setting up that could signal this upmove in stocks is about to end, but for now the trend is up.
HOUSING STOCKS

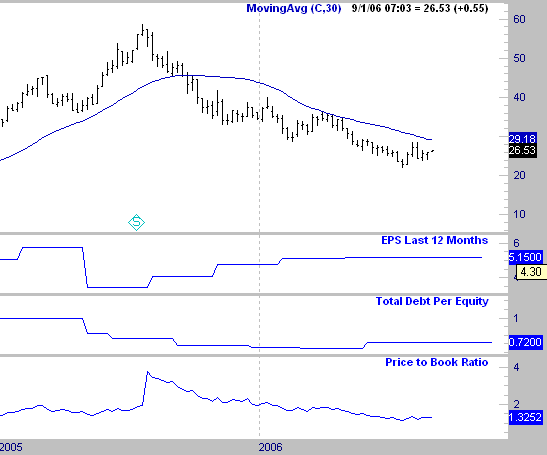
I have been asked quite a bit recently about shorting housing stocks and lenders. Many people know of my forecast about a year ago for a drop in the housing market. If I am so bearish on housing, am I short the housing stocks?

The answer is no, and the chart to the left of TOLL Brothers shows why. I have learned over the years that there is an upward bias in general to the stock market, so taking short positions really requires a "loaded deck." Loading the deck in stocks for me requires, trading in sync with the trend, and having valuations that match that trend.

In uptrends I want low debt and low valuations and good earnings, and in downtrends I want high debt, high valuations, and declining earnings. As you can see from the chart to the left we do have a downtrend in price. However, as we review the other 3 categories we see that we have rising earnings, low debt, and low valuations. These are the opposite of what I am looking for to short stocks in a downtrend.

As a result of this there are no short trades. It is really as simple as that. I do not inject my opinion into my model because opinions can be so arbitrary and hence unreliable. I do believe housing is in for some trouble here, but I do not ignore my model EVER! I may miss some opportunities, but I focus on the ones I do pursue, not the ones that got away. There is always another trade, but there is not always more money for the next trade if you have chased too many marginal opportunities.

Friday, August 25, 2006

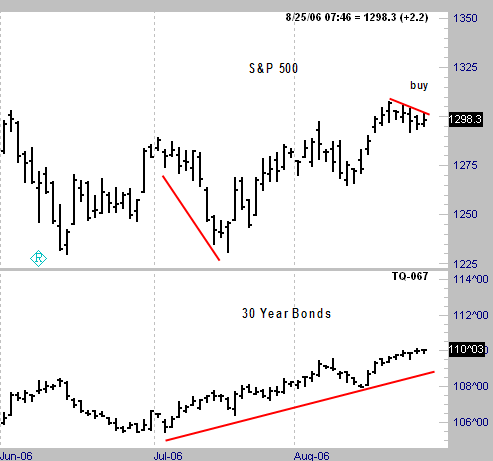
SP 500

Here is a chart of the S&P 500 Futures. We have a bull flag formed as indicated by the red line. We have had a nice rally off the lows that has broken the downtrend, and now we have formed a small consolidation flag.

This move up has also been supported by dropping interest rates ( higher bond prices ) charted below. Notice how the bond market started it's rally while the stocks were making their final drop down. This type of divergence often happens at market lows.

I have been looking for a drop into the fall to set up the mid term congressional election buy spot, but we may not get that. Seasonals say that we will, but this setup right here is fairly bullish for the very near term. I did not expect to see a rally like this at this time, so I have been wrong about this so far. A breakout above this flag is a legitmate long side entry in the market.
SP 500

Here is a chart of the S&P 500 Futures. We have a bull flag formed as indicated by the red line. We have had a nice rally off the lows that has broken the downtrend, and now we have formed a small consolidation flag.

This move up has also been supported by dropping interest rates ( higher bond prices ) charted below. Notice how the bond market started it's rally while the stocks were making their final drop down. This type of divergence often happens at market lows.

I have been looking for a drop into the fall to set up the mid term congressional election buy spot, but we may not get that. Seasonals say that we will, but this setup right here is fairly bullish for the very near term. I did not expect to see a rally like this at this time, so I have been wrong about this so far. A breakout above this flag is a legitmate long side entry in the market.

Wednesday, August 23, 2006

Housing Futures

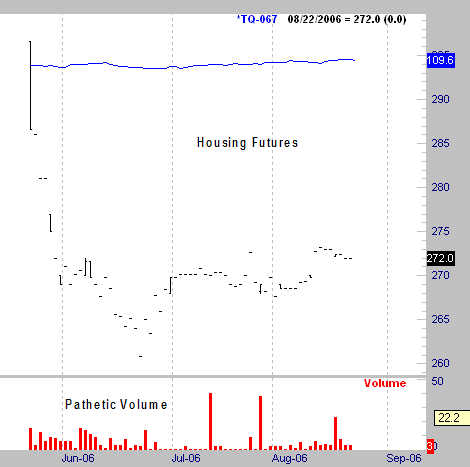
Here we have an update chart on the LA region housing futures. I hesitate to even call this a chart, it is just a bunch of dots on a page. The reason it looks like this is the complete lack of volume.

There are not even enough trades during the day to create daily ranges. This is a shame, as it undermines the usefulness of this product. As I have stated before, until the housing insiders become players in this market, it will not even be viable as a hedge play for individuals.

You could take a position, and be correct, yet not be able to get out of the trade with a profit due to the lack of liquidity. Now is a great time to be short housing just based on what appears to be a large scale dropoff that is beginning to unfold. However, you can not play it here with any degree of certainty due to low volume. I think the large scale players(builders) are hesitant to take a public short position for everyone to see for fear of undermining consumer confidence in this sector. That is just an opinion which may or may not be accurate. I do not know of another way for these companies to hedge their land cost positions which is currently cutting into their margins.

Tuesday, August 22, 2006

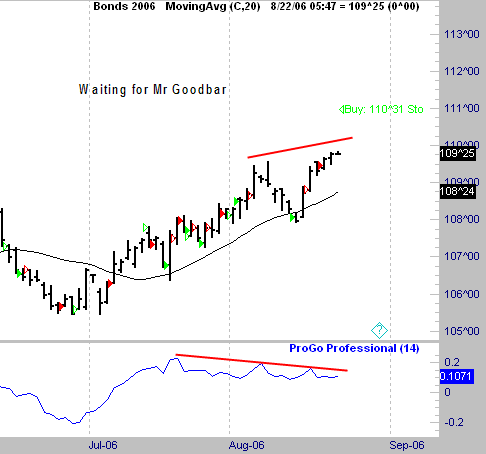
Here we are waiting for Mr. Goodbar

We are short the bonds here and awaiting that nice down bar. The trade is going against us a little at this point but we are about at the average draw down for this particular pattern.

Notice how we continue to have the indicator that measures professional activity within the day lagging the price move upward. I have displayed many of these in the past and it is typical for them to last for a bit. There is no magic to things like this dictating the minute it appears, price will crumble.

We are in a period of seasonal strength in this market, so we cannot be surprised that it is carrying on a bit. However, in general, when we see this type of setup a correction normally ensues. Once again, I display this as a tool. This trade entry does not have this as part of the rules for the entry. Divergences often show up against the direction of the main trend like this, so we need to be careful not to get too carried away with how we use them.

It should be noted, that a trading methodology could be constructed with this tool at the core of it, but it is a tool not the grail. In general divergences should be used to take profits in trends, not to fight the momentum of them.

Monday, August 21, 2006

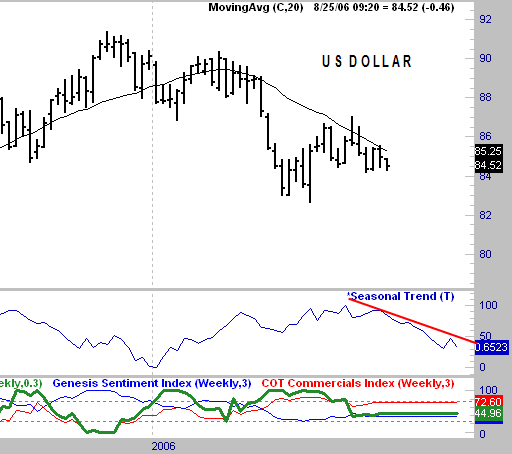
Blogger seems to be cooperating now. Here is a chart of the US DOllAR

Notice how the seasonal trend is heavily down from here on out. Also, we are in a downtrend, with a rally against the trend. The commercials are in middle ground, but are heading toward the short side of this market.

If we can get a small rally, or even sideways move, with the commercials shifting to the short side during that period, we will have a nice short sale setup.

Once that happens, just look for short term pattern entries on the short side to enter the trade.

Friday, August 18, 2006

BONDS

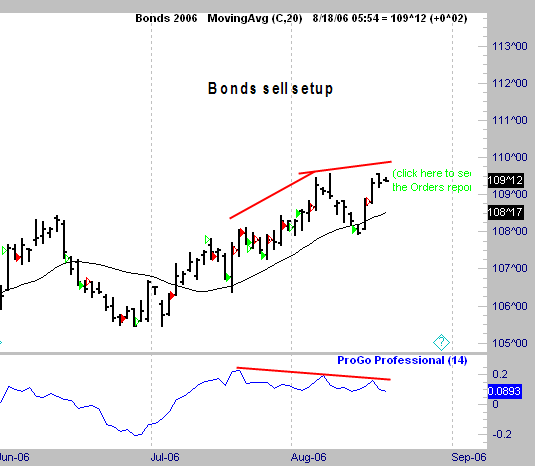
Here we see the 30 yr bond chart. We have had a nice rally off the lows and have broken the strong downtrend on the daily charts. Monthly charts still show a downtrend in place.

Notice how we have the ProGo indicator showing a divergence against this upmove. We have 3 higher highs in price with 3 lower peaks in the indicator. These 3 point divergences speak loudly that the insiders are not buying heavily into this upmove. The COT report comes out today, so we will see if the commercials are moving out of this market. As of last week they were reducing long positions.

The daily trading service does have a sell signal for today that has not been filled yet as I write this. It is NOT based on this graph. The daily service is a completely mechanical system and this type of visual is not programmable. However, I do like to see this type of thing backing a mechanical signal to take action. It combines a little art with alot of science.

Wednesday, August 16, 2006

CRUDE OIL

I am posting this Wednesday after the close. Crude Oil has come down a bit here in recent weeks, so let's look at the dynamics of this market.

First notice how the commercials have been steadily moving to the short side since the beginning of July and are now heavily short. Also at the same time look at open interest rising during this same period. What this tells us is that a rising percentage of positions were by the non-commercial players which is always a bearish sign.

Also notice how bullish the sentiment index is, yet another bearish sign. So at the beginning of July we have rising open interest, declining commercial longs, and bullish sentiment. These are what tops in price are made of. Does this mean we will have a huge fall, no. What it meant at the recent highs was that this was a selling opportunity until the above fundamentals change.

Tuesday, August 15, 2006

S&P follow up

It was good that I followed my rules (I always do) on this setup. We had a strong up day today, and that short trade I mentioned earlier would be underwater so far. This is why it is so important to have your trading rules line up as many things as you can supporting your decisions. That approach will keep you out of trouble for the most part. Trouble will find you in futures anyway, so why not avoid it when you can.

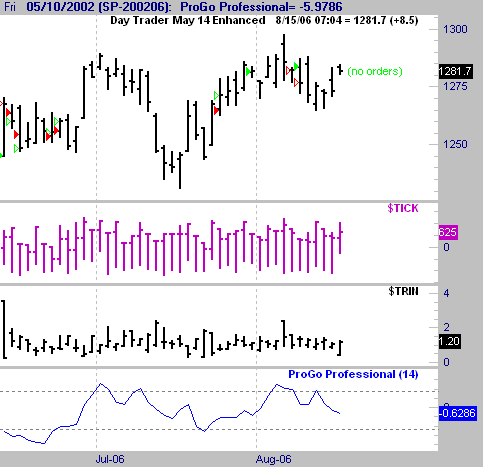
The chart I have here shows what I consider to be a bearish setup in the works. Notice the negative divergence between the ProGo indicator at the bottom and price. Insider buying is lagging this push up we are having. The bond market is supporting it, which is a positive. The commercials are currently in middle ground.

We have a seasonal tendency for a decline, so when we combine this with this lack of insider buying intraday, this sets us up for a fall. Ideally, what would happen is that we take out the high of 7 days ago, with the ProGo lagging this move. This would setup a short sale opportunity. What we currently have is a developing situation that needs to be watched. My system does not have any sell signals yet, but I am studying this closely to see if there is a pattern at hand to act upon. Nothing yet, but if I find one I will post the trade here.
S&P 500

I wanted to short this opening so bad I almost had the tie my hands behind my back to stop myself. A gap open above a day like yesterday just "looked" like a shorting opportunity to me.

However, although my pattern book does show a downward bias from several different angles, I could not dial this in tight enough to meet my criteria for trading it.

We can just watch it and review tommorrow what transpired. I will also continue to research this to see if there was something that I missed which would have given the green light for this trade.

I think it is of the utmost importance to have discipline in determining when and when not to trade. I may miss alot of trades, but all I am concerned with is what happens in the ones I do select. I have displayed the TICK and TRIN with this just for a different look than most of the other charts I post here.

Monday, August 14, 2006

STAYING WITH GOLD

As we keep following the story in gold the value of waiting for the breakout above the consolidation for entry has proven it's worth. The price never rallied enough to trigger a long position in this market (the area marked buy above), and look at the selloff we avoided.

It is generally not advisable to trade the downside breakouts of these formations unless it is with the overall trend. In this case it would have worked for a nice profit, but it is clearly against the trend in the market.

Just look through old charts and mark off these tight consolidation periods, and then note the breakouts which we call continuation patterns, in the direction of the overall trend. It is a very basic way of trading with the trend in the financial markets. This can be done with stocks as well.

Friday, August 11, 2006

T BONDS

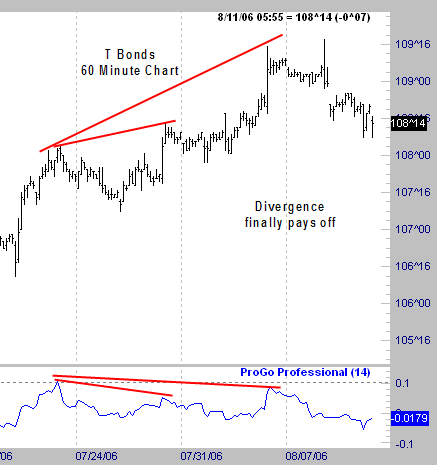
The bearish divergence that I pointed out in T Bonds last week has finally resulted in a price drop.

I mentioned that these can go on for awhile before anything happens and that is exactly what occurred. This is case in point about why you should not just blindly fade a market move just based on an "indicator" reading. This may not seem like it took that long in days, but if someone is trading a 60 minute chart, this is an eternity. The divergence first showed up at the end of last month.

To sit in a trade for two weeks that is based on a 60 minute chart pattern would rank as a poor trade in terms of timing. The whole point of using a 60 minute chart is to dial in the timing of a higher time frame setup

Thankfully, Paul McCulley from PIMCO said don't short bonds right at the high. So I shorted them. ( Just a wise crack - I did not short term due to his comments ) As a result the shorts did pay off from up there. Of course, his comments were based on a higher time frame than this. I doubt he cares about a one basis point move.

However, as a short term traders, that is $1000/contract or the equivalent of a $10 move in Gold. This is more than enough movement for us to profit from.

Thursday, August 10, 2006

GOLD

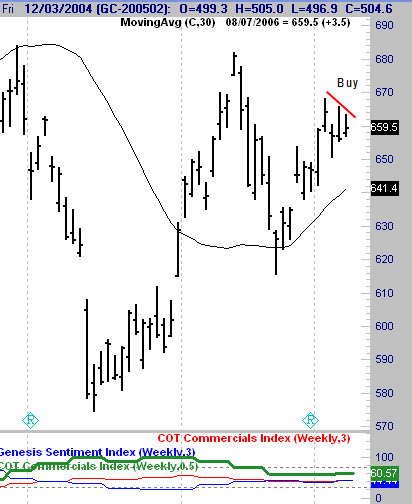
The consolidation/flag pattern in Gold continues. Today is a good example of why "front running" the breakout as I mentioned yesterday, is not a good idea. Waiting for a clear breakout of these types of patterns is important.

I would recommend waiting either for a close outside of the pattern, or at the very least a break above the high of 4 days ago, not including todays bar. That would mean the 2nd bars high that the red line connects to.

Discretion is required when playing these types of formations. This is why I do not trade like this. However, you have the fundamentals at your back so a breakout of this pattern, with the underlying trend and seasonal tendency, has a reasonable expectation for a profitable trade.

Historically the 7th trading day of the month ( yesterday ) and the 12th trading day of the month, have been the 2 best days in August to buy for a short term move. Yesterday, the 7th was profitable buying the open and exiting this am. It remains to be seen if the 12th will be. It would be a nice combination if a breakout were to occur on that 12th(bullish day) trading day of the month.

Rarely do things work out that perfectly in futures, but it is something to be aware of.

Tuesday, August 08, 2006

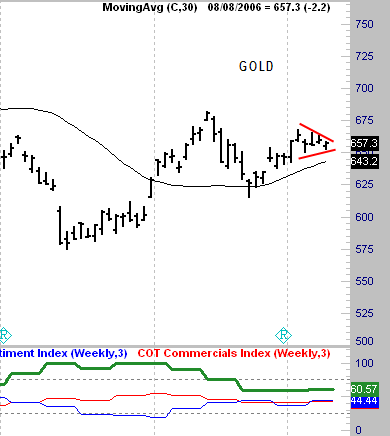
Our gold pattern continues to tighten up. Now we definitely have the tightening range type of breakout pattern we want to look for on a long side entry in this market. The seasonal tendency favors an upmove as well here.

I have bracketed the pattern for those who are not familiar with the flag terminology to see that it resembles a flag when presented like this.

This is a very basic continuation pattern that traders have used for years.

Monday, August 07, 2006

GOLD

Here we revisit the Gold market. I had discussed in the past trading little flag patterns with the trend. This is a smaller, tighter type of flag setup offering a better entry point.

This is just part of the general education I offer in this blog. If you are inclined to be a player on the long side of this market, a breakout in the direction of the longer term trend which is up, is usually a fairly low risk trade.

I want to also repeat what I have said previously, which is that I do not trade these types of patterns. In the old days I used to trade these almost exclusively. They do provide an overall edge in trading. We are at the time of the year that seasonally has an up bias in this market.

This is a short term pattern, if you are a long term player you should already have been long at 608 at the very worst.
T BOND FOLLOW UP

Here is a prime example of what I spoke about the other day regarding indicator divergences. I have mentioned the negative divergence that had developed in bonds between insider buying and the price. I had also said that these can carry on for awhile, and were not a trigger by themselves.

Notice how the bond market has continued to rally in spite of this divergence. I have seen this happen many times during trend runs like this. Make no mistake, on a "short term basis," this market has a strong uptrend going. All these types of things are is tools to give you a general direction of what to look for next.

It it tough to go with markets, against the direction of the divergence. At times this is exactly what one must do. I do have a short position on that is based on a bar pattern. It needs to be stated, that it was not put on because of this divergence. It was based on entirely different parameters. These divergences are not programmable, they are just things you can see and observe.

Thursday, August 03, 2006

Housing Futures

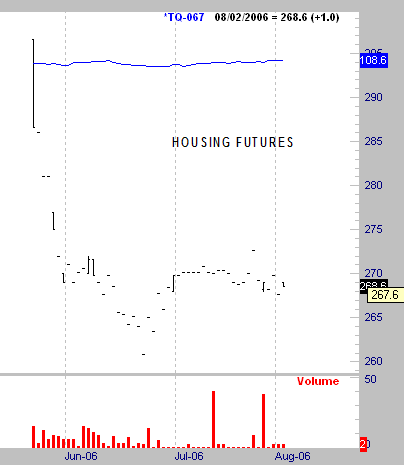
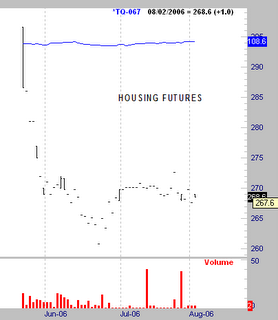
Perhaps the only thing that is a bigger bust this year than housing itlself, is the housing futures launch. This is a textbook example of what we would call an illiquid market.

If you just take a cursory glance at all of the other charts I post in here, you will immediately notice a big difference. This chart is just a bunch of dots. Also, looking at the volume at the bottom, there is not much if any trading going on at all in this market.

I had stated openly, that I feared this would not be the vehicle everyone hoped for prior to it being launched. There were a couple of reasons why I felt this way. First, to fully hedge the amount of equity many homeowners have, someone would have to take a very large position. Since everyone would be looking to take the same side of the trade, liquidity on any exits would be unlikely. As a result, you could be right about a drop in price, but by the time you got out, you could actually lose money.

Someone has to be on the other side of the trade for this liquidity to be there. The second reason was that I thought the homebuilders would be hesitant for PR reasons to hedge in this market. They are the ones who could place enough money in this market to create liquidity. However, can you imagine what would happen if a story came out that said a large builder had just recently taken a big short position in housing futures?

Time will tell if this market has a future. Maybe as the price drop picks up some steam, volume will pick up. However, I would suggest that it will not. The big players (builders) already know what is in the process of happening, and they are still not putting any money here. It would be contra to the nature of insiders to chase something down. The hedging they generally do is on the front side.

Participation by the "big money" is always needed to provide proper liquidity for trading. Until this market picks up some of that, it is not worth looking at.
Wednesday, August 02, 2006

GOLD
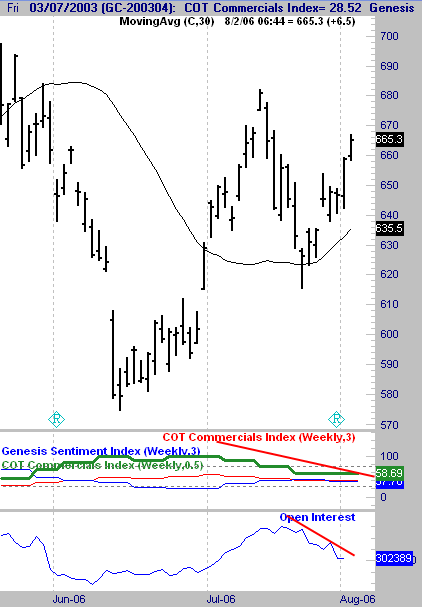
As a follow up to the post from a few days back about GOLD, here is how we look at present. The breakout from the flag has actually been successful. I had commented about how those types of flag setups, with steep wide range bars were low probability, and that I expected this to fail. I was wrong about that, but not wrong about the probabilities. These types of patterns, even though this one worked, are not high probability trades. I am not going to catch every move. I just want to catch the ones correctly that I choose to trade. This is done by trading only the highest probability setups, and having the discipline to stand aside during these types of periods.

Trading can be very exciting, but there is no need for there to be excitement caused by foolishly losing money.

Notice how the commercials below are exiting this market on this rally, and that open interest has declined significantly. The open interest decline only is significant in that it is declining due to commercials exiting. If it were declining due to non-commercials exiting, it would not be a negative.

I would expect a sell spot to potentially develop if this trend continues.

Tuesday, August 01, 2006

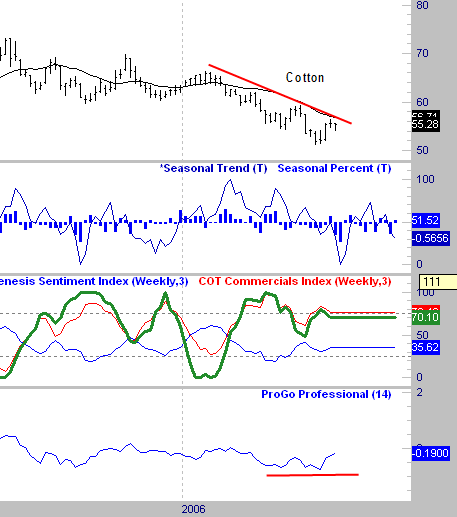
This is a Cotton Chart. This is beginning to look interesting. Notice how we are approaching the typical seasonal low. The commercials have been increasing their long positions in general on this dip the last few months.

The Red Line is just a basic trendline, nothing fancy there. This market is in a pronounced downtrend, so we do not want to get too carried away with catching the knife on dips. We need to watch this to see if the commercials increase their longs on a break to new lows in the next few weeks.

If this were to occur, then one good place to buy would be on any break above the downtrend line. We could buy weakness on that condition also, if we got some type of divergence. The Pro Go at the bottom is diverging somewhat at this point. If price were to make a lower low, with Pro Go not following, that is another possible setup. We will follow this here to see what unfolds.