DISCLAIMER

PLEASE READ THE DISCLAIMER AT THE BOTTOM OF THIS PAGE WHICH APPLIES TO ALL CONTENT IN THIS BLOG AS WELL AS ANY OTHER MATERIAL FROM WE ARE FUTURES TRADERS LLC. READING ANY CONTENT BELOW CONSTITUTES AN AGREEMENT BY ALL READERS THAT THEY HAVE READ AND AGREE TO ALL THAT IS SET FORTH IN THE DISCLAIMER AT THE BOTTOM OF THIS PAGE.


Monday, November 27, 2006


Correction?

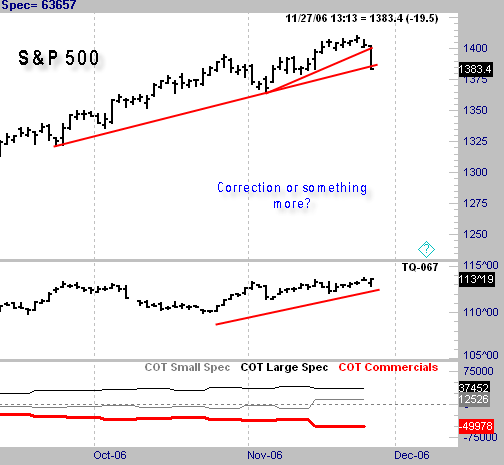
We finally got what appears to be the first leg of a correction. Is this the beginning of something more or not?

So far it is tough to tell. There has been some heavy insider selling going on toward the end of this up move, which could spell some trouble. However, in the absence of that, this appears to just be the beginning of a long overdue correction. Notice how strong the bond market is underneath, which is what we want to buy into a decline.

We have broken the most aggressive uptrend line so far, and are sitting on the second most aggressive trend line. This is to be expected. Upmoves that just go on and on without meaningful retracements leave themselves vulnerable to these quick air pocket type of declines. Now it is time to start paying attention to see if this decline is an ordinary one or something to be more concerned about. So far, no alarms are going off but stay tuned.
GOLD

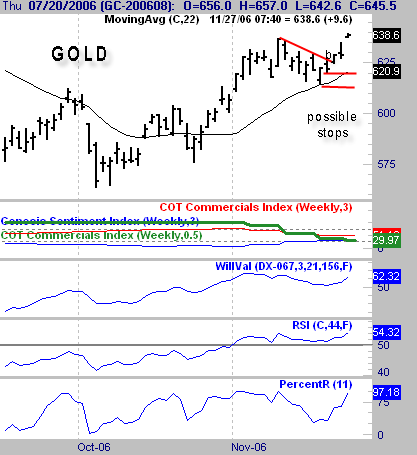
As a follow up to the Nov 17th post, here is the updated GOLD chart. By now traders should be long this market if they played the flag break in the area of where the b is on the chart. I have marked with horizontal red lines, two possible place for stops to be placed.

Partial profits should be taken at this point due to the gap up open. Once the profit equals the risk, it is prudent to take half of the position off and trail a stop on the balance. This gives a chance for a home run on a portion of the trade, but locks in a profit in the event of a reversal.

As you can see from the third chart down, GOLD is not undervalued relative to the dollar here, so an explosive upmove, although possible, is not highly likely. However, the trend is up, and you are long, so stay with the trend and see where it takes you. I would suggest moving the stop up under pivot points that form along the way.

Anyone who does not know what pivots are, shoot me an email.

Friday, November 24, 2006

S&P 500

I exited my short trade on the gap down opening this morning for a small profit. Although disappointing because this signal is normally a big winner, a win is a win.

It is hard to have much expectation of large wins when trading against an uptrend of this magnitude. Even though we know a sharp pullback is coming at some point, timing it is another story.

Month end biases are in general upward so it seems unlikely any drop will occur prior to December, if it even occurs then. Nonetheless, if I get any more sells from my trading system, I will take them and see how they play out.

Wednesday, November 22, 2006

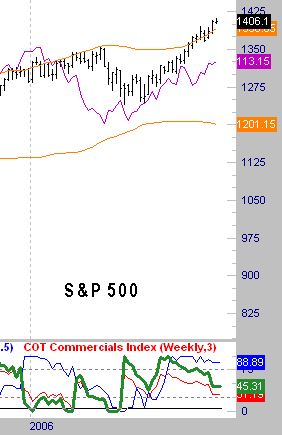
Here is an update S&P 500 Weekly chart

We are working on a 5th weekly close above the 2.0 standard deviation band, hence a tremendously extended market. One development that bears watching is the commercials. They are moving toward that short side of this market.

The purple line is the bond market, which remains strong. When we get into a running market like this with virtually no pullbacks, it is very dangerous to step in front of it. A reversion at the very least will occur, but timing it is impossible. Some traders I know will just probe over and over fighting trends like this until they hit the number. They do not mind taking alot of small losses as long as they ultimately get the big win.

I do not subscribe to this theory. I do have a short trade on right now, but it is very short term, and generated by my system. This in no way means that I am calling for a major top yet. Pullbacks are still buys in this market.

Here is what could change that. First, a break down in bonds, and second, a heavy short position by the commercials.

Monday, November 20, 2006

S&P 500

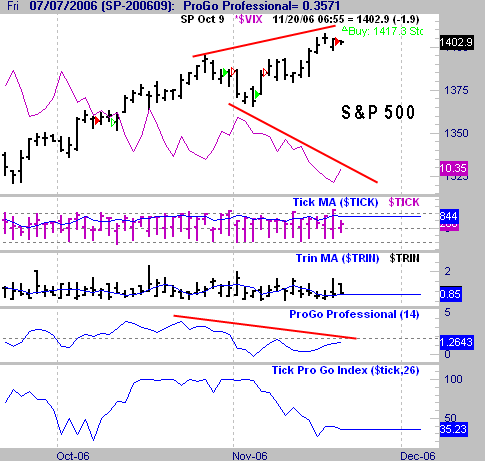
The big upmove continues, but we have possible flies in the ointment for the first time in quite awhile. You can see the trades I have made in this market recently, which have been few in number. Today's short entry is the first short trade in the last 40 days or so.

Notice the heavy progo divergence in the 3rd panel at the bottom. Also, the vix, in purple on the top chart has really been trending downward sharply. This warns of complacency in the marketplace. Short term timing with the VIX is difficult, but it does support the other potential problems with this rally.

Make no mistake, this uptrend is very powerful, and I do not expect to see a sharp drop. However, at some point we should see a sharp short term retracement to "shake the tree" a little bit. I have no idea if it comes from right here or not, but I am short as I write this in a short term trade.

Friday, November 17, 2006

GOLD BUGS ALERT

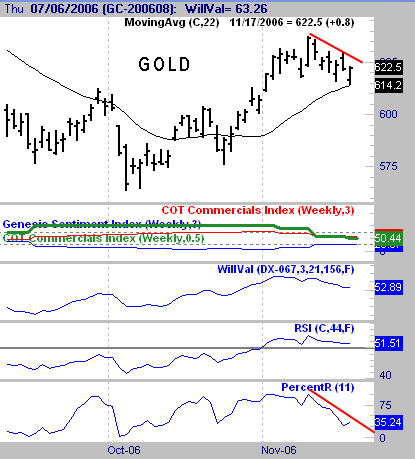
For all of you gold bugs, we are getting the pullback against the trend that is setting up a long entry opportunity. You can either wait for the pullback to get to the lowest low of the last 10 days and just buy with a pre-designated stop, or buy the breakout of the flag.

I prefer buying the weakness, but that is just me. Sometimes you miss trades by waiting for that weakness that never develops.

Wednesday, November 15, 2006

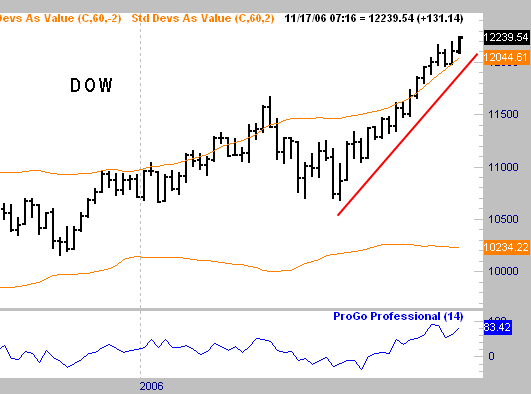
DOW JONES

The mid-term election cycle rally is certainly in full swing. As I stated in my newsletter, I have nowhere near the position on that I would like to have had on this move.

However, it is important to stay away from emotional tendencies when these big moves happen. As you can see from this chart the market has moved straight up with virtually no correction at all for many weeks now.

As tempting as it may be to chase this, at times like this you have to remain disciplined. A pullback will occur at some point, and when it does assuming the rest of the internals of the market are still good, it will be a good buying opportunity.

The bond market has remained strong, which is the type of support we want underneath for a trend like this to continue. I am waiting for an entry spot to load the boat, it has not developed yet. It may not develop, only time will tell. We are very extended on a short term basis, so it could happen at any time.

Friday, November 10, 2006

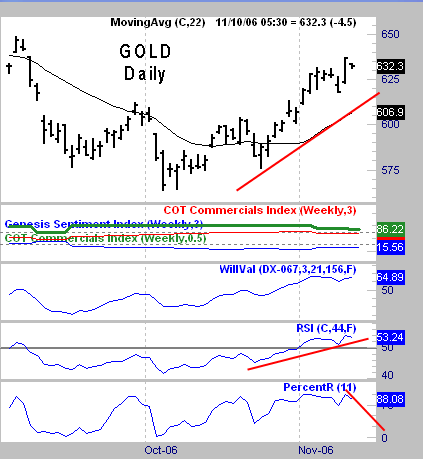
Here is the daily chart of Gold that I refer to in the second post. Now we have an uptrend, so buying the dips is the prudent play.

Percent R is a stock choice for most software packages. If you have it just wait for a reading of 10 or less, and buy the market once it gets to that reading. Use a trailing stop of whatever your risk tolerance allows. It should be itleast $10 due to the volatility of this market, and probably much more.

If you do not have that indicator, all it represents is the close compared to where it is within the range from high to low of the last 10 days. A 10 reading tells you that you are in the lowest 10% of the last 10 days range, hence oversold.
GOLD

I am back from Italy. Sorry for the lack of posts the last week, I had some technical difficulties with the Hotel and their internet access.

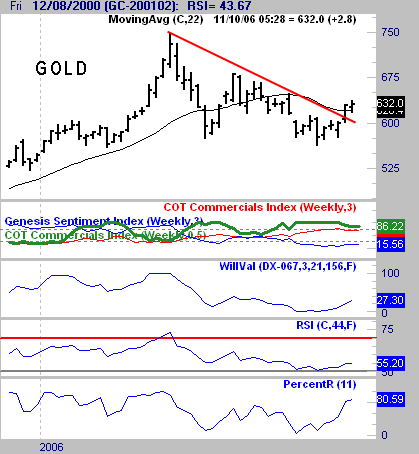
Gold has broken out of its downtrend and should now be traded from the long side. Here is a weekly chart of GOLD as of this morning. The key 574.50 level that I mentioned for closing, did hold.

Next is a daily chart which shows the shorter term uptrend better. Just wait for pullbacks against this trend for entries.

Thursday, November 02, 2006

VACATION

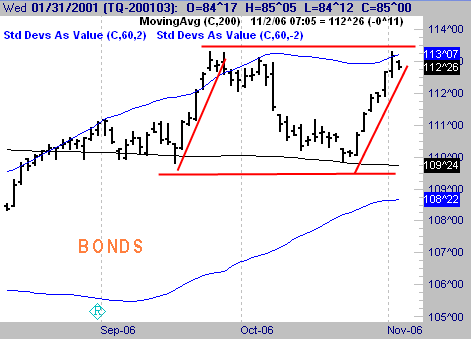
I will be in Europe for a spell so there will not be daily updates until next week. For subscribers who may be frustrated that the bond trading system has not generated many trades lately, I have displayed this chart.

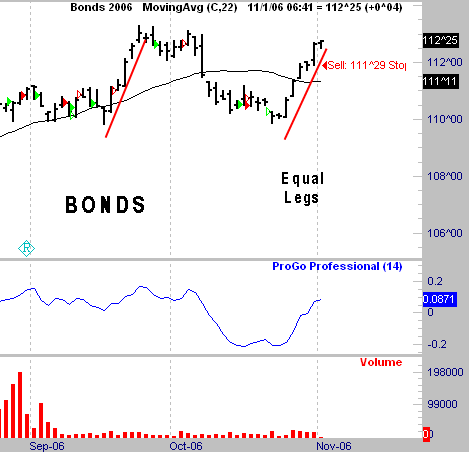
Keep in mind that my goal is not to get every wiggle, although I would like to. The goal is to be consistently profitable. This means at times we will not be in the market. Yesterdays post addressed the trading range scenario we have at hand. Notice now how what I said in my newsletter, written before this happened by a couple of days, has turned out to be true. This recent leg on the chart has mirrored the prior up leg to within 1 tick of the exact price.

Now we are at the top of the range, so why no short for today? Simple, this opening is the type of opening that on average is not wise to short. Due to the overbought situation of the market, this one may work as an entry. However, it is not high probability in my system and as a result is a no-go.

Sometimes the best thing to do is not trade and wait for the right moments. The system actually had a few potential buy signals up here that were filtered by some of my screens for entries. Until next week ......


Wednesday, November 01, 2006

BONDS

For those of you who subsribe to my services, I made mention in my monthly newsletter about symmetry in the middle of trading ranges. Here you can see how these uplegs look very similar. Trading in the middle of ranges like this is very dangerous.

Often the price swings all the way back to the other side like this, but not always. Sometimes you get stuck in the middle, with choppy action. You can see a sell 111'29 stop indication, which was filtered out as an order for today due to this range configuration, as well as the gap up bars.

I know that someone mentioned they felt rates were going to rise due to a fundamental reason. Who knows, that may happen, but right now they are dropping. Big picture fundamental things are very hard to dial in to short time frames for trading purposes. We are now approaching the upper range, where sell signals will make more sense. Hopefully, my system will generate some sell signals up here against these highs.

If I had to guess I would say that this rally is being generated by weak economic news, but that is just a wild guess.

Monday, October 30, 2006


GOLD

Here we now have a clearly defined triangle on a weekly GOLD chart. I have mentioned for a long time that 574.50 was a key level, and that any close below it would signal the end of the GOLD bull market. We have held that level so far and have bounced up right into the declining top of an obvious triangle formation.

Some gloom and doomers are calling for 35,000 or some such nonsense as the ultimate top of this market. (Just kidding about that number, but the predictions are ludicrous) It is also still undervalued against the dollar on a short term basis (the 3rd graph). If we get a breakout of this triangle on the upside on a CLOSING basis, this market can be traded from the long side on pullbacks.

Do not get tied into this inflated adjusted skit that people talk about who do not trade, as a basis for comparing these levels to historical levels. This is then used to extrapolate prices well into the thousands for target prices. Traders trade on the prices that are here, absolute levels. Economists talk about these other things, while being wrong time and time again in their predictions. Although you might want to keep that rap in your repertoire for cocktail parties and the beautiful women you might want to impress.

Thursday, October 26, 2006

GOLD

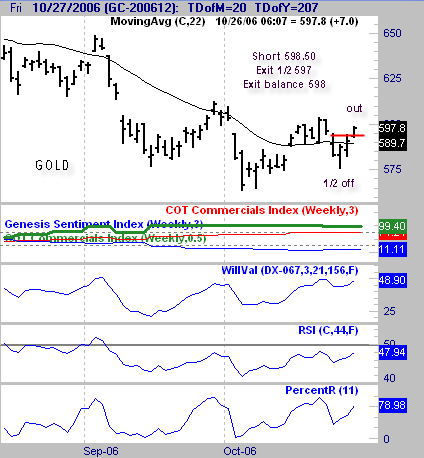
Here is the completion of the gold trade. The remaining contracts were stopped out today at 598 for a .50/ounce gain, essentially just covering the commissions. Remember that more than 1/2 of the contracts were taken of at 597 for a large gain on that portion of the trade.

This is part of money management. When confronted with a large quick gain on a postion, I suggest taking 1/2 or more or your position off for a profit, and stopping the rest at breakeven. This way you have the potential for a windfall on the rest, but are protected in case something like this happens.

NEVER allow a huge gain to become a loss EVER!!!!!!

Tuesday, October 24, 2006

Gold

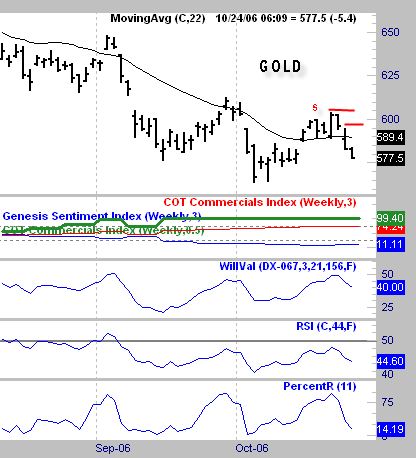
I pointed out a few days ago when Gold was at 598.50 that it was a short setup. As you can see that trade has a $21/ounce or slightly over $2,000 per contract gain. For anyone who took this trade the stops can be placed at the red lines depending on your level of aggressiveness.

Taking partial profits here would also be prudent if you have multiple contracts. For me the stop is at break even on remaining contracts at this point, $598.

Thursday, October 19, 2006

Time for a little patting on the back - my own

Over to the left is the last update on the Robbins World Cup trading contest which features my bond trading system from the daily trading service offered on my web site.

As you can see, the account being traded there, which features these signals alone, has a nice 46% YTD return. It needs to be stated that the commissions and fees charged in these accounts are much higher than what is normally charged for self directed trading, and represent a drag on the return which brings it down to this level. Most of my other accounts with lower fees have returns in the 55% range due to this differential.

The main reason I have done this was to simply demonstrate out in the open for anyone in the public who wishes to see it, that my trading service does produce profitable trades consistently. I have not traded this to "win" which some of the contestants clearly have. There have been some wild swings in account balances as people have come and gone from this leaderboard. That is too stressful of a way to trade for my taste.

I have used consistent conservative money management to closely mirror what an individual just using prudent risk paramaters could have achieved using this service. There are some of you out there who have traded my service this year that have benefitted nicely from this. I have no idea how any individual might have managed his or her own trades within the signals given. YTD the signals have been 26/34 for 76.4% accuracy and a $5,118 per contract gain.

Tuesday, October 17, 2006

Golden Short Setup

This is not truly Golden it is just a play on words. Here we have a typical retracement against the trend setup. One trend measure that has written about by a few people over the years is just using the RSI and it's absolute value to determine trend.

I discovered this about 10 years ago just playing around with concepts and did use if for short term trading. More recently, Larry Williams has referenced this in his writings. Great minds think alike? Just kidding about that, but he suggests the 44 period setting so we will use that for this discussion.

Above 50 indicates an uptrend and below 50 indicates a down trend. The PercentR is a short term measure of over bought and over sold taught originally by Larry Williams. This tool is part of most software packages for trading. As you can see it indicates an overbought condition in a downtrend, hence a sell opportunity.

Friday, October 13, 2006


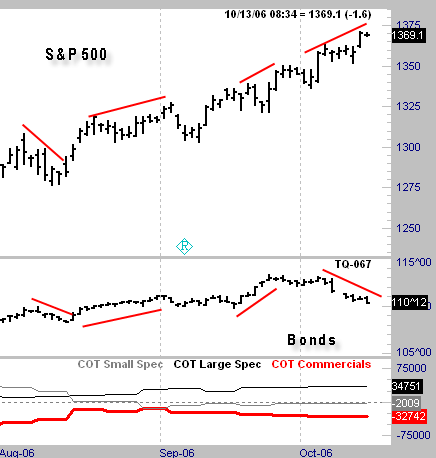
Displayed today is the S&P 500 and the bonds. Notice how all the way up during this big rally, the bonds have supported the S&P in both directions as indicated by the lines on the chart, until recently.

Now that the bonds have broken their uptrend, they are diverging from the S&P. It is early in the game for this to be a big problem, but it bears watching. Sometimes these divergences can carry on for months before anything happens like in May when it finally mattered.

However, in July the bonds started bullishly diverging from the S&P and almost immediately the stock market rallied. So, this is something that at the very least should tell folks to cut back their long exposure to stocks and be prepared to get out if we get a break down in S&P 500 prices.

At this point it is just a caution warning, but this rally is so extended that even the election bias is not going to save it from at the very least a pullback. Figure out your own ways of using this tool, it is worth the research time.

Wednesday, October 11, 2006

BONDS

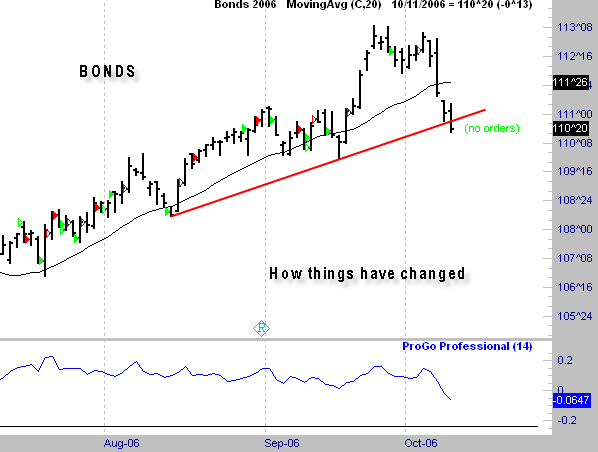
Well things have certainly changed. No matter how we draw the trendline upward it has broken at this point. I had mentioned that I was suspicious of this uptrend but until the trend broke pullbacks were long entries. The reason for that suspiciousness on my part was that we had reached the 2.0 std deviation point at the highs, so we were very extended. This along with the commercials being heavily short were reasons for caution. These influences negated long entries that "might" have generated on the initial drop.

The trend has now broken. It still could be what we call a bear trap meaning this is a sucker move to lure bears in before moving higher, but it certainly does not feel that way. No matter how I test this pattern right here it is bearish. We are getting oversold, so we may get a buy signal here shortly in the trading service.

We do have a strong seasonal bias up for Friday so maybe that will bring a bounce upward, but this market appears to be in some trouble overall at this point. If we continue down, this is going to cause some problems for the stock market. So far we are only at 15 day lows, but if we get to 30 day lows it will be trouble in river city.


Tuesday, October 10, 2006

BONDS

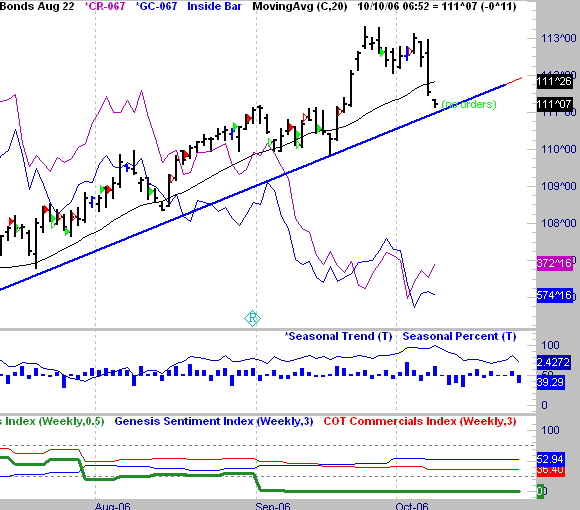
We are precariously close to the uptrend line in the bond market. So far today, we have a gap down that has not been filled. Over time gap down bars are not good setup bars for buys the next day, so I will probably be on the sidelines again tommorrow in this market watching.

I feel it is very important for this market to hold right here. This market has helped propel equites as well as keeping a reasonable floor under the housing market. This certainly appears at this point to be more than just a pullback especially with the commercials heavily short, but technically it is still holding on but by a thread.

Friday, October 06, 2006


Bonds Living Dangerously?

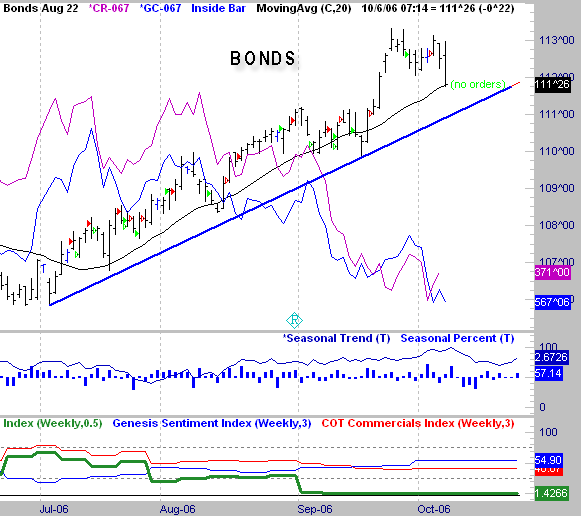
Here is a daily chart of Bonds and the retracement that is taking place. The blue line marks the uptrend, which is still intact. This could just be a normal pullback and my system will probably have buy signals for Monday after today if we close here. I really wanted to short this market today last night, but the pattern just did not line up well enough. When in doubt, I stand aside.

However, for the gloom and doomers out there, if we break this uptrend that will be trouble for the stock market. Lower rates have driven this rally recently, and if that underpinning is removed I think stock prices will drop off.

You can see that seasonally we are due for a little drop here at the beg of October. This could very easily just setup a nice bull flag for a long entry. Let's hope this uptrend holds. The heavy commercial short position is a fly in the ointment here as you can see at the bottom of the chart. They have been early to the party. It will be interesting to see if the commercials have lightened up their longs in the SP 500 on today's report, I bet they have.