DISCLAIMER

PLEASE READ THE DISCLAIMER AT THE BOTTOM OF THIS PAGE WHICH APPLIES TO ALL CONTENT IN THIS BLOG AS WELL AS ANY OTHER MATERIAL FROM WE ARE FUTURES TRADERS LLC. READING ANY CONTENT BELOW CONSTITUTES AN AGREEMENT BY ALL READERS THAT THEY HAVE READ AND AGREE TO ALL THAT IS SET FORTH IN THE DISCLAIMER AT THE BOTTOM OF THIS PAGE.


Thursday, July 26, 2007

Is it time to panic?


We are in freefall at the moment, so what to do next? As indicated on the chart, I just went long the S&P futures, am I nuts? Maybe, it is never easy to buy into declines like this, and also not always the correct thing to do. Why am I doing it?


First, my long term model is still in the long side only mode, so I am looking to buy short term weakness within that. If you look at the red line on the chart, specifically in the first sub-section, we are at a very low level. This is a proprietary indicator that measures advancing issues on the NYSE in a unique way. It has rarely been this low in recent years. Second, I mostly follow my systems with small amounts of discretion thrown in along the way. I have no way of knowing when an individual trade will win or lose, and when I thought I have known this in the past, I have usually been wrong. As a result, I rarely pass a trade due to my opinion about the outcome. It is true, that if this is in fact a trend change, this trade will lose.


From a short term basis, there is no reason to buy into days like this because it is clearly a news driven down trend day and these types of days can really get away quickly. The system that generated this trade is about a 10 day hold on average, and often the first few days go against the position. As hard as it is to watch this adverse move, it is typical of these types of trades.

I am constantly trying to find ways of filtering out bad trades like this one "might" be, and have never been able to find a conceptually correct way of doing so. As a result, I just take them as they come up and hope for the best over time. Ten of the last 11 in this system leading up to this trade have profited, so there is a good track record with it.


Wednesday, July 18, 2007

Satellite Internet Sucks

I simply have had such trouble getting consistent Internet connections, that it has made it very difficult to post regularly here. I will do my best to do a better job of it going forward. It has been all I could manage to place my trades much less do much else when the Internet cuts in and out randomly at the most inopportune times.

To the left is the weekly S&P Chart, and as you can see the world has not ended since my last commentary. I had stated that if that last small pullback was all we got, a good sized up move could be coming. We have seen that, and there really are no exit sirens blaring right now.

We are nearing the time of year when we can usually expect a decline to occur, so I am watching closely right here. However, as long as the commercials stay this heavily long, we should be ok. Today we got a big down intraday move, but they rallied it back most of the way by days end. We opened about 50 down in the Dow, and that is where we closed. Most of the reasons cited by the bears here for a down move are actually bullish indications, and they just do not understand them well enough to see it. High short interest is bullish, not bearish to name one of them.

I will keep close tabs on things, and may in fact bail out when the seasonal tendency kicks in just because of the large gains I have in the stocks I hold, over 20% as a whole just since April. However, you always want to let your profits run, so never take a full position off just for a dollar amount reason. Taking partial profits, if it is part of the plan is prudent. It is not prudent if you think "well I have made alot so I should get out" ... etc..

Tuesday, June 26, 2007

What next for the S&P?

Here is the weekly chart, and you can see that the commercials have jumped back heavily to the long side of the market. This is bullish when we are already in such a strong uptrend, just the smallest dip and they bought back in heavily.

The bond market decline is reflected in my Magic Potion indicator at the bottom, but it has abated somewhat in the last week. There are certainly alot of news items that are making intraday swings interesting lately, but overall as you can see, we really have not had much of a retracement.

It would be nice if for a change, positive news got some media coverage. Why is it always the negative stories that get the most attention? Should anyone really be shocked that a few mortgage related funds have some trouble? You would have to be sleeping in a cave not to be aware of the issues in Real Estate right now! This is why that story only hurt the market for about 2 hours, but it still killed the party.

I expect us to move sideways with an upward bias for the next month or two at which point I will be looking for any signals that the party is over. If all the pullback we get is what we have had so far, another good sized up leg could be coming. As always, I will follow my rules as far as when to exit my longs, these are just opinions based on what I am observing.

Tuesday, June 19, 2007

Nothing Really New

There is not anything of note that has changed with the stock market. You can see my Magic Potion indicator is in the red, which is not good, but it is only one of the components of my system. The rest are still firing away in Green Mode.

The commercials have dropped down to 69, so they have backed off some. If they were to drop significantly, and everything else stayed the same, my system could trigger a sell signal. If I had to guess, I would say that they will gradually taper off on thier longs over the next 4 to 6 weeks. This would coincide with the July/August typical seasonal high, and indicate an exit then.

Only time will tell if that will take place. Until that happens, it is stay long and ride the trend. Do not be a hero trying to fight this trend. Unfortunately many of our great heros died earning their reputation, you will also if you fight trends. You may get lucky once in a while, but over time, you will get run over.

Monday, June 11, 2007

A Picture Paints A Thousand Words

Off to the left is the 30 Yr Bond Implosion. I have displayed standard deviation bands just to give a visual of how extreme this move has been, relative to recent action.

We are below the 3.0 band right at the moment, and as I type this, have a very weak overnight session going once again. Rarely does this market get extended to this degree in either direction. There is a gap down from 3 days ago that is unfilled so far.

There is alot of logic and math that will tell you that a reversion to the mean is imminent when these types of extensions occur. While this is true, they generally occur when a very strong trend is underway, and hence, you are fighting the trend playing for that reversion. My Short term bond trading system did generate a buy today, but has struggled recently during this down move. Most of my patterning is based on "normal" market action, and alot of the general rules go out the window when you get a move like this. You cannot pattern your trading activities for the once every 5 year occurence, or you will struggle most of the time. All that can be done is install strong money management techniques, so that you do not get wiped out when you get a move like this.

I do expect some type of reversion to occur, but it will setup a short entry if it does. This trend is very strong, and will not be easily reversed.

Thursday, June 07, 2007

SEE I TOLD YOU SO
This is inevitably what the chicken littles are going to say after today. I did not imply from the last post that I was predicting this, only that this was a potential sign of trouble. Had I been trading from a short term perspective I would have been out before today, but I am not with stocks.

A sharp correction like this is scary and brings out the doom and gloomers. Maybe they will be right this time, we do not know at the moment. The precipitous drop in the bond market today once again shows its merit in directing stock prices. Notice how we have already hit the 2 standard deviations down level on this retracement, generally a good place to buy in an uptrend.

I am waiting for the COT report tommorrow to see how the real insiders have handled this. If they have scurried for the sidelines which I doubt, my model may generate a sell signal. Most of the stocks that I own have not fallen much during this drop, which is a positive, one has risen.

For now I say to stay the course on the long side, and if that has changed I will post something here.

Tuesday, June 05, 2007

S&P 500
I apologize for having been so negligent in keeping up here. I have been juggling alot of different things, and have had tremendous internet problems at my home. Satellite internet sucks for the record!
As you can see, the Jaws of Death have shown up for the stock market. This is a pattern that has led to many severe declines in the past, so why am I still bullish and heavily long stocks?
Notice at the bottom, the heavy long position the commercials have established. What I think will happen is that the rally will continue for awhile, the commercials will gradually shift away from the long side, and if this happens, yours truly will exit his longs.
The trick with this formation is that is sometimes can persist for a few months to 6 months before anything happens. As a result, for the time being, it is just watch this closely for signs that it is leading to trouble. Sorry for the poor spacing, Blogger is not in the mood apparently tonight to allow me to put spaces between the paragraphs.

Wednesday, May 02, 2007

Here is the close out of the short trade from the other day, exited on yesterdays opening for a nice profit. This shows that there is value in shorting at times against strong trends in short term trading.
Not all trades work out like this, but if you pick your spots carefully, you can succeed. As you can see from the chart there have been very few short trades my system has generated in the last 30 days, which is good. When markets run like this they are difficult to trade, because most of the time they trade a bit more two sided.

For the average investor, I suggest staying on the long side here, and buying pullbacks. Fighting a trend like this is a losers game over time. In my early days I used to fight trends like this all of the time, and learned from the school of hard knocks not to do it. I did do it here and profited, but I have 20 years of experience trading, which gives me a small advantage in picking my spots carefully.
If you choose to do it honor your stops and keep your egos at the door. When a market is running like this there is no telling how far it will go. It could stop tomorrow, or go for quite a while.

Monday, April 30, 2007

S&P 500

Here is the trade I currently have on for the S&P 500. As you can see it is a short position. I am bigger picture bullish, but that does not mean that short term sell signals cannot be taken. The recent COT report did show heavy long positions on this recent rally, which is very bullish larger picture for the market.

I do view any pullbacks as buying opportunities and I think those that are waiting for the big selloff are going to have to wait until the end of the summer. Predicting is a difficult undertaking for anyone, but that is how I see it at the moment.

This trade will be exited shortly as it is a short term trade and appears to be headed for a profit.

Monday, April 23, 2007

S&P 500

I posted a couple of weeks ago there was possible trouble due to weak bonds. As we can see, there has been some short term strength that has entered that market. This was the lone remaining shortcoming of the rally off the lows, that has now been resolved. I am aggressively long stocks from a couple of weeks back, when the short term trend down trend of bonds broke. I was waiting for a pullback, but decided based on the strong seasonal pattern, to pull the trigger and just add to my positions on any pullbacks.

I was concerned that the breakout that was brewing due to the small ranges I mentioned, would happen upward, and I did not want to miss it. We also have the commercials on the long side as well. We are hugging the 2.0 standard deviation band on the high side, which tends to happen during strong trend moves. This does tell us that we are short term overbought, but I would view dips as a buying opportunity for now.

We do have to keep a close eye on the bond market, which is showing some weakness as I type this. If we were to get a big drop there, it will undermine this rally at some point.

Friday, April 13, 2007

CRUDE OIL

For those of you that get my newsletter, the Crude Oil trade is summarized to the left. I had said to short it on 4/2/07 and exit when the percent R closed under 25. The entry was 65.10 and the exit was 62.01, a profit of $3.09/barrel. This yielded $3,090 per contract so I hope some of you did this trade. Things rarely line up as perfectly as that one did, so the trades have to be taken when they do.

Wednesday, April 11, 2007

STOCKS

Here is how we look on 4/11/07. Once again the resiliency of this election rally has asserted itself. My long term indicators have never gone away from the long side, so they indicate to still be long. We do have some possible trouble brewing with the Bond Market.

The Blue Line marks 30 yr Bonds, and as you can see, this market has had a sharp move down in the last 30 days. This happened while stocks rose nicely during this same period. These types of divergences often spell trouble for stocks. We are in the early stages of this divergence, but it is probably not a time for an aggressive long position without a pullback in price first.

Also note how the average daily range is getting quite small, indicating very little volatility. Generally, these conditions lead to breakouts in price, one way or the other. The commercials are still heavily long this market, so that is a positive. I am looking to enter this market on the long side aggressively, but not without some type of a pullback first.

Thursday, March 29, 2007

S&P 500 The Latest

Here is the latest picture of the S&P 500. This weekly chart is nice to look at because it keeps things in perspective. You can see that prices have not really dipped much in spite of what some of the people calling for a crash have said.

The commercials have bought this little dip, which is bullish. However, you can see that my Magic Potion indicator has turned negative. This just stand alone is not enough to short the market on a larger scale, but it is reason to expect a sideways to down move here for a period of time.
Overall though, I do not expect to see a large break in the market until the end of the summer, but I am hoping for a dip in the next few weeks to load up on the long side.

I will need to see that bottom indicator turn green to confirm the upmove, which it has not done yet. My overall timing system does still say to be long this market, so dips are buys assuming that indicator goes green on them.

Thursday, March 15, 2007

S&P 500 The Latest

Let's take a look at where we sit now with the S&P 500. If you remove the emotion out of the moment, you can see this decline has not been that significant. We have broken the uptrend, but we do not have a crash on our hands. You can see I had a short term buy yesterday that profited, being exited this morning.

I have drawn a red line down indicating the short term downtrend that we have established. Underneath this, under the blue line which is bonds, I have a red line indicating the nice uptrend we have there. At the very bottom, I have drawn a line that indicates we have had some commercial buying during this drop, this is what we want to see. Strong bonds and commercial buying, are both supportive of stock pricing.

The commercial buying is not at the level "yet" where it is strong enough to act upon. However, if this index gets over 80, that will change things a bit. As long as the bond market stays strong, and the commercials continue to increase their long side exposure, I am looking for a buy setup for a several month hold coming up soon. My large picture timing indicator has not flashed a sell yet, so buying dips is the call until that happens.

It would be nice to get one more sharp dip that has heavy commercial buying to set this up perfectly, but things rarely setup up in the optimal fashion. We may move sideways to lower for the next few weeks instead. Either way, I am looking for a buy spot.

Friday, March 09, 2007

Banking Stocks

Someone asked me to take a look at the Countrywide situation. I believe the thinking was that with the subprime mortgage overnight implosion, there might be a spillover effect.

First, for those of you who are reading my blog for the first time and or, are not current clients, I need to briefly explain how I trade so that you can view my comments in the right context.

My orientation to trading which has evolved over the last 24 years, is that I only take loaded or very high percentage trades. This is how I achieve an accuracy of 80% wins to losses. As a result, I establish criteria, and only go in when those criteria are met. This is not to say that there are not other ways to trade profitably, there are. However, to trade and get the results that I require, I need to have this level of discipline.

For stock trading, what I want to see is improving earnings for buys, declining for shorts. I also want low debt, or itleast a declining trend in debt for buys, the reverse for sells. I also want the seasonal tendency to be at the very least nuetral, not against the way I am looking. Then I want a pullback against the trend for entry. I do not care about what I call the "story." The story is the subjective situation surrounding the company that I may have an opinion on. Opinions are to suject to emotional influence, so I stay clear of them when trading.

Countrywide, if we use my criteria, would be a counter trend entry to the seasonal if it were shorted here, so that is not good. Debt is flat, but technically slightly rising, a negative. We are awaiting the recent earnings statement to see where that currently stands, that mark that as an unknown. Also, we are in a current retracement in a flat market, which is a better buy than sell in general.

In summary, this is not set up the way I require for a short entry. This does not mean that this stock will not go down, it is just not a short entry that I would take. If you are playing the story, you need to step in front while it is at a high level, here we are just in the middle of a trading range, so this entry has "poor location."

Monday, March 05, 2007

S&P Update

Here is how we look as of the close of Monday. We have continued downward even though we have had a couple of intraday snap back rallies that good day traders could have capitalized on. Most day traders lose money, so do not be tempted by that endeavor.

Notice the carrots on the chart which indicated potential signals. All of these signals (the last 3) were filtered by my secondary trading filters. We have been trading the bonds here the past week, but nothing has triggerred in the S&P.

I have been through too many of these to try and be a hero, I will take the signals when they come regardless of the market environment. If I do get any here, I will take them with half the normal size due to the increased volatility. I do hope for this decline to setup a rally in 30 - 45 days more or less.

I have highlighted the gap on the chart, because that is an ominous pattern. For this market to have gapped down, and not tested it, or even close in the ensuing days, does not speak well for the immediate future of this market. However, we are extremely oversold, so the odds to not favor shorting at these levels. Wait for a bounce to enter new short positions. We are likely to have volatile action in both directions, so honor your stops.

I do expect some further downside action, but I do not believe we are going to get a runaway bear market out of this due to the strength in bonds.

Thursday, March 01, 2007

Where do we go from here?

I had mentioned that I would have buy signals for Wednesday, but none of them were triggerred, so I am flat(no positions). Today we come in with a gap down open following an inside bar with an up close.

Historically this has been a good buy pattern and poor sell pattern in general. However, none of my systems generated any buy signals, and in fact one generated a sell signal that was filtered due to the bullishness of the pattern. I want all the stars aligned, so nada for me today.

I do urge caution for those of you not to react too emotionally during these types of periods. Do not chase the market, and please trade smaller positions than your normal size. It is tempting to want to make a killing during a period like this, but more people blow up than make killings during market crashes. The worst thing that can happen is to bet the farm on one short position, have it pay off, and have a bad habit reinforced. Market conditions like this come around once a year for a week or two, so you can not pattern all of your methods on the rare occurences. Do not pyramid and press your bets. There are likely to be sharp moves up and down over the next week, and you can really get whipsawed.

The trend has changed here, but we are really overextended down right now, so the odds of a sharp bounce are high. You do not want to be short the farm when a 20 point bounce in the S&P happens.

Tuesday, February 27, 2007

What Now?

The big one that alot of people have been looking for finally happened today. You can see by the chart that alot of damage was done today. I would love to tell everyone I called this in advance, like last May.

However, that would be false. I had been warning that we were setting up a sell signal, but my large picture sell has not triggerred yet. After today, it will not ,simply because one of the components requires an overbought condition, which is now weeks away.

Days like today take on a life of their own, once the selling begins with this type of power all that you can do is honor whatever stops you have in, and let the action take place. Many reversals do happen after heavily negative overseas action like we had last night, so we cannot always know that this type of blowout will follow that.

If I had to guess what will happen next, I would guess the following. A little more weakness over the next few weeks. Then a bounce up that fails to make a new high, setting up a larger picture sell signal that syncs up with my timing indicator. There have been a few instances like this for those who get my newsletter, that were pointed out last month. This is only a guess, with no real basis other than just my years of experience, it may or may not have any value.

For those trying to trade in here, what I would suggest is to cut back your size to take into account the increased volatility that is likely to be here for a bit. Next, honor your stops and do not get emotional. We do not have many days like this historically, so the sample size is too small to have a reliable read on what will happen tommorrow. We are already very extended down, and historically 5 consecutive down closes in the S&P which we have had, have been good short term buys. I will more than likely be buying the S&P on Wednesday depending on what my systems tell me.

It is possible that this is an isolated event, but there are not many historical days like this that just result in things returning to normal right away. The strong bond market should provide some strength underneath this soon.

Sunday, February 25, 2007

Still no Sell Signal

The end of last week refused to give the sell signal, so it is still a long side market. I am relieved simply because it would have had to have been ignored due to the seasonal up bias still in place. If we get one in March it will be past the filters for time of the year.

We may not get a sell signal, so there is no reason to be short until one develops. We have had a tremendous run, and the trend is up, so ignore the gloom and doom of the doubting Thomas types and stay with longs until we get something that says not to. There are some internal aspects that have weakened slightly, as you can see the commercials are mostly on the short side. As a result the base underneath is not as strong as it has been for the last several months.

All this really means to me is to not add too agressively to existing longs at this juncture. It does not mean run out of the market and hide.

Wednesday, February 21, 2007

Stocks Peaked?

Here is an updated view of my "Magic Potion" indicator. There is no magic to it actually, but just a goofy name a gave it to make fun of myself. As you can see it has returned to the green, indicating a buy. However, based on the computation of it, if prices stay where they are the rest of the week, it will go back into the red.

There was never an official sell signal generated during those 3 red bars because the other components of the timing system did not confirm it. They are all presently confirming any sell signal in the underlying, if the week closes with all of the components where they are as of this posting. It is February, so a sell signal now should just be used to get flat. In general we do not want to be aggressively short during the first two months of the year due to seasonal effects.

If march rolls around and the indicator is indicating a sell at that time, we will have something to act on. Until then, the trend is still up so no need to do any shorting.

Thursday, February 15, 2007

S&P 500

Here we have an updated S&P chart. You can see where I exited my short trade from a few days ago on Mondays opening. This is exactly why I exit short term trades against the trend very quickly, had I held that position, I would be sitting on a big loss. The way I exited brought in a very nice profit of 13 S&P points.

I have written in my newsletter about my larger picture timing system that I have developed for the S&P. Although very close to triggerring a short sale indication, it has not done so yet. It will most likely be held off for itleast another week due to the rally in the bond market (red line).

I do expect this bond rally to slow down here and perhaps move back down in the next week or so, which might setup the S&P sell signal at that time. There are several components to that system, and most are lined up on the short side, but not all of them. Until it signals a sell, it is still green light to the upside, and exit counter trend trades quickly.

Tuesday, February 13, 2007

Shorting the Lenders

There has been alot of talk about shorting the lenders lately, so I thought I would devote a day to discussing this. Accredited Home Lenders is displayed over on the left. As you can see it has dropped from a high of 60.13 to a last trade of 24.50. It is clearly in a downtrend, yet if we look at the last 12 months earnings, we see a nice uptrend. Also, another filter I like to look at is debt. Their debt ratios are actually dropping.

Many people are expecting both the EPS to deteriorate, as well as the debt to increase, due to the difficult period that lenders in general are in.

However, as I have told people over the last 6 months to a year with the homebuilders, the balance sheets of most of these companies have very attractive ratios still. This does not make them prime candidates for shorting. I want deteriorating debt ratios, and declining earnings for stocks I am shorting, and the reverse for stock buy candidates. Further, this is a stock that has already dropped 60%, so although there may be more downside, the fat of the move is already over.

For those that cannot help themselves, and are dead convinced that the worst is just beginning, I suggest just waiting for 3 to 7 day reactions upward against the downtrends to taks short positions, or buy puts. Then hope the downtrend resumes. These little retracements visually look like flags, so we call them bear flags. I would start this process by looking at stocks that have increasing debt and declining 12 month earnings ( not just one quarter ). This will itleast line up the fundamentals with the "story."

For Sam, NFI has fallen way more than these others from 70.32 to a last of 15.96, too late there. NEW is the same story. AHM looks better as the 12 month EPS has declined and debt ratios have risen, and the stock has only dropped about 25% off the high. However, it is not in a downtrend yet. I would wait for a break, and short the first retracement of that one.

Sunday, February 11, 2007

S&P 500

Here is an update of the daily S&P 500 chart. You can see my system has me short as of Friday's opening. This is a short term trade that will be exited on Monday's opening. My big picture timing system is ever so close to giving a sell signal now, it just missed on Friday's close.

Not to worry because most significant highs are not made in February, so we will probably go up itleast one more time. My short term signal was based on entirely different parameters than the big picture system.

Notice large divergence that continues to be in place with the Bond market below. This at some point is going to spell trouble for stocks, and it may already have triggerred something. The small graph at the bottom is just a moving average of the tick index. This is something I am playing around with, but have not really found any use yet for. It can be ignored.

The commercials have also gotten heavily short as of this last weeks report, so it is only a matter of time before a decline hits.

Sunday, February 04, 2007

S&P 500
Displayed to the left is the weekly S&P chart. It may be tough to see, but the large picture swing system I have is applied to that chart. As you can see it had a long entry back in late August of last year, and is still long.
It is getting very close to generating a sell signal, but it has not done so yet. Very few market peaks are made in January or February, so there is no need to get excited and step in front of this trend. However, as you can see, the sharp downmove that the bond market (purple) has made recently, has set up a large divergence with stock prices. It is possible for these divergences to persist for a few months before stocks are effected. If this relationship stays like this, it is only a matter of time before we see a big stock market decline.

Friday, January 26, 2007

BOND UPDATE

We have had a substantial move down in the bond market this week. As you can see, we have broken through the 2.0 standard deviation bands (the blue lines). There is really no magic to these lines, other than they tell us when a short term move has traveled more than a normal amount. I have covered this in past newsletters.

However, it is still a nice visual aid to help with a larger picture perspective on things. I suppose the more positive than expected economic news is the explanation for this move, but I could care less. You could also argue that the rise in gold, was the primary cause.

With the primary seasonal tendency for a decline at this time of the year, combined with the well defined downtrend in prices, we should be looking to sell rallies against the trend. Buying oversold conditions for reversions is another strategy that can be employed, but it is not for the faint of heart. My short term system will do that in the trading service, but I do not suggest that the average person do this. Staying in sync with the primary trend of the markets, is where most of the money is made.


Monday, January 22, 2007

BONDS

Here is a weekly chart of Treasury Bonds. As you can see we have had a decent sized decline recently, right after the PIMCO bullish comments were made. At this point we are still technically in an uptrend, but a very choppy one that is difficult to trade. Trading retracements this deep with trend trading techniques, makes for sleepless nights.

We are still holding above support (marked by the red horizontal line). The RSI is reading 49.90 with is neutral. Due to the seasonal down tendency during the first half of the year, I expect this market to head lower overall by mid year, breaking this support level. If this happens, that would mean higher interest rates. It does seem at the moment that the Fed is determined to not lower rates, so this kind of makes sense. However, be clear, that I do not get tied up in "THE STORY." Those are just observations only.

I look at fundamental conditions and mechanical measurements of things to tell me where we are. I only mentioned that because it ties in what appears to be a broader economic situation, with the mechanical conclusion I spelled out initially.


Thursday, January 18, 2007

STOCKS

We are getting close to a bigger picture sell signal in the stock market. I have a proprietary indicator that is fundamenally based, that has been declining, and is close to going negative. The commercials are also heavily in the sell territory as you can see.

When these two things combine at the same time, moves lasting longer durations, and also of larger magnitudes begin. You can see that it triggerred the sell signal in May that I pointed out the day before it happened. It also indicated the buy in July/August.

The way that it triggers makes it likely that the end of next week would be the soonest it could give the final confirmation of a sell. It may not, but it is certainly something to be on the lookout for. We also have to watch the commercials to be sure they are still short if the Magic Potion indicator crosses into the red. If the commercial buying picks up it would nullify the short signal.

Thursday, January 11, 2007

DYKSTRA SAYS BUY................

Well I guess we should buy, Lenny Dykstra says so. I heard on CNBC yesterday that former major leaguer Lenny Dykstra is a fund manager and is buying Oil stocks right now. I heard the interview, and he sure sounds like he has no business running a fund. This has bad ending written all over it. Maybe I will find a way to short him!

Buying into these huge declines can at times be rewarding, but it is catching the falling dagger. I had my head handed to me more than enough times in my early days, to not try this any more. I have no idea where the bottom is, but I will throw this out there: since we rose on no fundamentals, why can't we decline the same amount, due to the same lack of fundamentals?

The hard demand numbers never justified the exponential rise and now the fraud in gasoline pricing is becoming clear. Gas prices are not dropping, I wonder why? The fact of the matter is that these speculative price moves that we often see in Oil, Metals, Real Estate, are the result of basic human emotions acting collectively. As a result, it is impossible to measure when these momentum driven price moves, like this one downward, will run out of steam.

Stick with the trend, short the rallies and do not be a hero catching the knife.

Monday, January 08, 2007

CRUDE OIL

Last week I posted a chart of Crude Oil saying that it was setting up as a sell, but might just roll over. This is what happened. When you are in a strong trending market, surprises generally happen in the direction of the trend.

It is impossible to determine exact price targets. For now the trend is down, so trading should be done on the shortside on reactions upward against the trend.

Wednesday, January 03, 2007


HAPPY NEW YEAR
Do we have a stock drop coming to welcome in the New Year? I think we do for several reasons. First, bonds have weakened considerably in the last 30 days. Second, there has been a seasonal tendency for a decline in January the last 5 years or so. Third, the VIX continues to be at a very low level.
The blue line on the chart represents Bonds, and you can see the downward move that has taken place. I have drawn in the wedge formation in red, which does not mean much. All this shows us is that recently, prices have been contained in a narrowing range. There is no magic to these lines at all contrary to what many people have written about them. However, they do graphically depict the support area short term in prices.
Now that the year end bonus game for fund managers is over, there is no reason to just blindly support any dip with buy programs in the futures.
As a result, if we do get a break down, it will not likely get the immediate snap back that we saw during the 4th quarter. Sorry for the poor formatting in terms of paragraph breaks and spacing, the new version of blogger is not letting me edit this post for some reason.

Tuesday, December 26, 2006

CRUDE OIL

Here is a weekly chart of Crude Oil. It is clear that we are in a strong down ward trend. The commercials got long during the decline, which is more than likely just normal hedging operations, but has resulted in a small rally against the trend.

If there were to be a move up toward the 67 area and an accompanying shift to the short side with the commercials, this would be a very nice short sale setup. It may not move up that far, but choosing ones spots carefully is a very important component of a successful trading strategy.

Sometimes moves are missed by waiting for things to line up properly. There are fellow traders of mine that have the mental makeup to trade at a very low win to loss ratio, knowing the big wins will overcome all the small losses. These folks just fire away at marginal opportunities all day long, not being able to afford to miss any move that comes along. This is a very dangerous game to play. I prefer to pick and choose my spots, and am willing to see moves go by if they are not setup properly.

Thursday, December 21, 2006

S&P 500

Will this ever end? It is never wise to fight a trend like this, and I have not been doing it. We do have a little divergence happening now with weak bonds, market by the down trending red line. This is not enough yet to be a big problem, but may result in itleast a buyable pullback soon.

This market has carried on for a very long time without even a 10% pullback, which is rare. With the commercials now short, it is not advisable to put on any new long term long positions here. Still, shorting this market is still very risky. The insiders have a lot at stake in keeping this move intact through the end of the year.

I will be watching the pullback closely in January to see if it has more dire hints, than just a pause to move higher again. If the commercials do not get long during that pullback, neither will I.

Monday, December 18, 2006

GOLD

Anyone who has either read this blog or is a client of mine, knows that I am not in agreement with the long term GOLD to the moon scenario. However, I trade shorter term than that anyway, so here is what we see as of today.

We have clearly broken the small uptrend off the lows from under $600. The declining line now indicates what the trend is, and it is down. RSI is also under 50, confirming this downward trend.

What to do next? Wait for a 3 or 4 bar retracement up against the downtrend to go short. If the market were to hold here and rocket upward changing the trend back to up, then buy the pullbacks. For now, however, it is short the upward flags against the downtrend.

If you take a broader view, we are really in a sideways market in general for the last several months here. As a result, you can always fade the range when we get to one side of it. We are basically in the middle now, in a short term down trend.

Thursday, December 14, 2006

On the 9th I posted a thread about broadening formations drawn in here to the left. I mentioned that these patterns are very "noisy." What this means is that they are not very accurate % wise, but do create big wins when they are correct.

Here we have a typical scenario with them, the first trade, marked with a small red line, would have been a loss. How did I know not to take this trade?

There are a few reasons. First and foremost, the exact pattern at hand within the broadening pattern was not near accurate enough to make my system for the S&P. Second, the bond market has been very strong. Third, it is unlikely that the insiders pushing this rally are going to let much of it get away before year end bonus time. As traders we have to think about what we are doing at times, and if something flies in the face of several reasons why it should not be done that have a fundamental basis, that trades needs to be passed on.

This market "may" crack at some point, but it is still on firm ground, and anyone's guess as to when this rally will stop. The commercials are short now, so that tells us a pullback is probably coming in January. There has also been a seasonal tendency in recent years for declines in January.

I would suggest studying broadening patterns and coming up with your own ways of using them. This is an ongoing project for me. If I ever crack the code on how to use this well, I can assure you I will keep it to myself!!!!!!!!!!!! For now, it is a discretionary tool.

Wednesday, December 13, 2006

Bonds

The bond market is experiencing a decline here for the first time in awhile. Every time the PIMCO guys make a bullish comment, in the short term this seems to happen. Maybe it is just a coincidence, or maybe there are a few wise guys who trade size that fade them?

The uptrend is still intact, but we would not want to see alot more of this type of action or it may be in jeopardy. There is no magic to this, we just have to buy retracements in sync with the underlying trend until it changes. I have not gotten any buy signals in my short term trading system on this pullback so far.

It is important to note, that the commercials have gotten short in the S&P, so the bond market holding it's uptrend becomes very important. If it were to break it, the stock rally would be in jeopardy.

Saturday, December 09, 2006


S&P 500

Here is a chart that displays the short term entry point, for anyone trading the broadening pattern in the S&P 500 I mentioned this past week. Once the pattern is formed, you short at the first break of a prior days low, with a stop above the high.

This is a noisy pattern, but the wins when they come are often very big. The win/loss percentage is low on this pattern, probably about 50%. When they occur at an extreme like this, in theory they should be a little more reliable, but I am not sure if that is true or not. I have not as yet been able to program this pattern, to fully test it. This is due to the almost countless variations that could be in place, that would qualify for the setup. It is much easier to visually identify it.

In any event, you will often be fighting big trends when entering these trades. Just study them on your own to see if they are of any use to you. They can be traded on all time frames, from a 5 minute chart up.

Wednesday, December 06, 2006

GOLD UPDATE

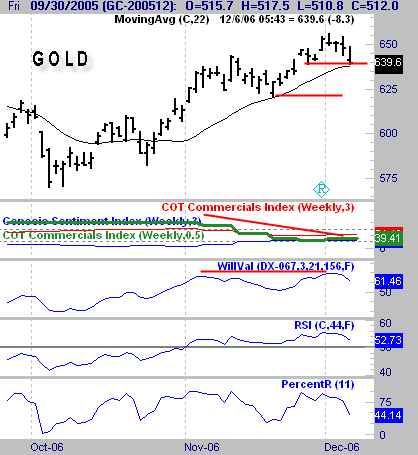
For those of you who are long the gold market, the inevitable pullback is happening. I have marked two possible stop placement areas with horizontal red lines. If you recall, I had recommended taking partial profits on the long previously due to the overbought condition in relation to the dollar. This is marked by a horitzontal red lone in the third window.

The first red line would be the most aggressive stop point. This represents the most recent pivot point. The other red line represents, the pivot point prior to the recent one.

Really strong trends, do not take out these pivot points, so this one does not look so good right here. We do not always follow the textbook with market moves, which is why taking partial profits helps you make money on a trade like this that did not work out all that well. It rose more than $20 from the entry point, which is $2000/contract. You never want to let a profit that big become a loss.


Monday, December 04, 2006

Megaphone

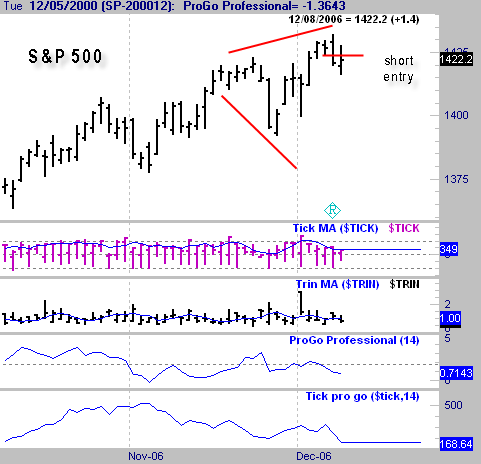
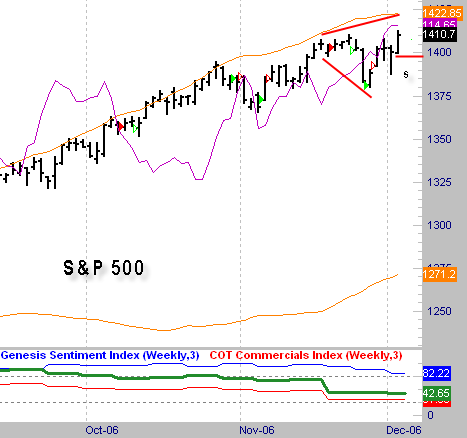
This is the S&P 500 as of the close of today. I have drawn in containment lines that resemble a megaphone or broadening type of pattern. There are certain ways of trading these types of patterns that are profitable.

I have drawn in a s below the horizontal red line which represents a possible short entry for Tuesday. This is just below todays low. If this low were to be taken on Tuesday, it would represent a false breakout to new highs today.

This is a discretionary pattern that is hit and miss, but if you go back and look at March of 2000 in the NAZ, you will see this pattern right at the highs. I have traded this pattern on all time frames and had some big hits, and also periods of losses. I point this out to beginners just as a field of study. I also continue to study this to see if there is any way of making it mechanical. I have not as yet found a way of doing that.

As a result, this is just a feel type of pattern. There is no doubt that there is major manipulation going on holding this market up this high, so we are really fighting the house shorting this market. However, this pattern does seem to conveniently show up at major turning points often. It bears watching.


Monday, November 27, 2006


Correction?

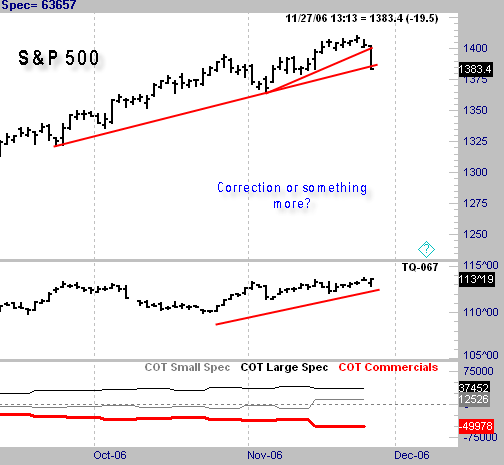
We finally got what appears to be the first leg of a correction. Is this the beginning of something more or not?

So far it is tough to tell. There has been some heavy insider selling going on toward the end of this up move, which could spell some trouble. However, in the absence of that, this appears to just be the beginning of a long overdue correction. Notice how strong the bond market is underneath, which is what we want to buy into a decline.

We have broken the most aggressive uptrend line so far, and are sitting on the second most aggressive trend line. This is to be expected. Upmoves that just go on and on without meaningful retracements leave themselves vulnerable to these quick air pocket type of declines. Now it is time to start paying attention to see if this decline is an ordinary one or something to be more concerned about. So far, no alarms are going off but stay tuned.
GOLD

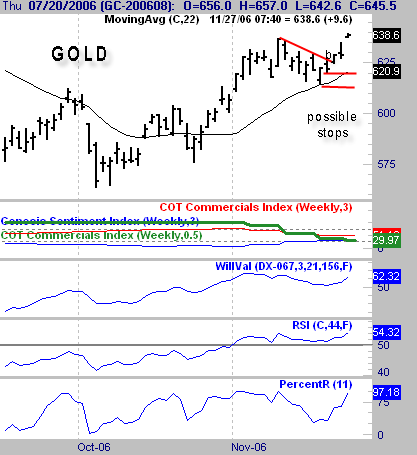
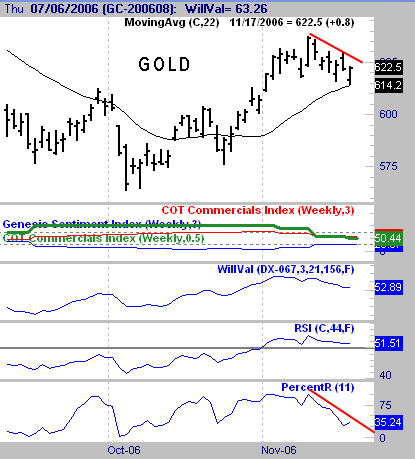
As a follow up to the Nov 17th post, here is the updated GOLD chart. By now traders should be long this market if they played the flag break in the area of where the b is on the chart. I have marked with horizontal red lines, two possible place for stops to be placed.

Partial profits should be taken at this point due to the gap up open. Once the profit equals the risk, it is prudent to take half of the position off and trail a stop on the balance. This gives a chance for a home run on a portion of the trade, but locks in a profit in the event of a reversal.

As you can see from the third chart down, GOLD is not undervalued relative to the dollar here, so an explosive upmove, although possible, is not highly likely. However, the trend is up, and you are long, so stay with the trend and see where it takes you. I would suggest moving the stop up under pivot points that form along the way.

Anyone who does not know what pivots are, shoot me an email.

Friday, November 24, 2006

S&P 500

I exited my short trade on the gap down opening this morning for a small profit. Although disappointing because this signal is normally a big winner, a win is a win.

It is hard to have much expectation of large wins when trading against an uptrend of this magnitude. Even though we know a sharp pullback is coming at some point, timing it is another story.

Month end biases are in general upward so it seems unlikely any drop will occur prior to December, if it even occurs then. Nonetheless, if I get any more sells from my trading system, I will take them and see how they play out.

Wednesday, November 22, 2006

Here is an update S&P 500 Weekly chart

We are working on a 5th weekly close above the 2.0 standard deviation band, hence a tremendously extended market. One development that bears watching is the commercials. They are moving toward that short side of this market.

The purple line is the bond market, which remains strong. When we get into a running market like this with virtually no pullbacks, it is very dangerous to step in front of it. A reversion at the very least will occur, but timing it is impossible. Some traders I know will just probe over and over fighting trends like this until they hit the number. They do not mind taking alot of small losses as long as they ultimately get the big win.

I do not subscribe to this theory. I do have a short trade on right now, but it is very short term, and generated by my system. This in no way means that I am calling for a major top yet. Pullbacks are still buys in this market.

Here is what could change that. First, a break down in bonds, and second, a heavy short position by the commercials.

Monday, November 20, 2006

S&P 500

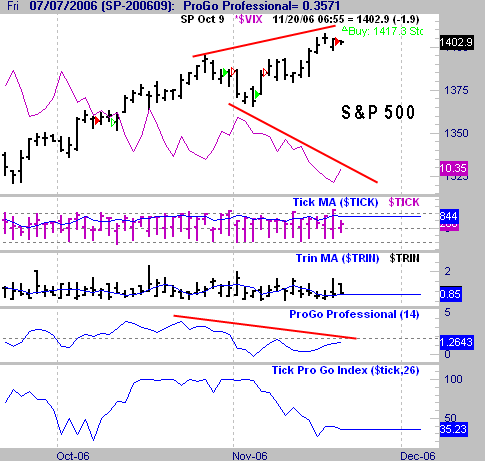
The big upmove continues, but we have possible flies in the ointment for the first time in quite awhile. You can see the trades I have made in this market recently, which have been few in number. Today's short entry is the first short trade in the last 40 days or so.

Notice the heavy progo divergence in the 3rd panel at the bottom. Also, the vix, in purple on the top chart has really been trending downward sharply. This warns of complacency in the marketplace. Short term timing with the VIX is difficult, but it does support the other potential problems with this rally.

Make no mistake, this uptrend is very powerful, and I do not expect to see a sharp drop. However, at some point we should see a sharp short term retracement to "shake the tree" a little bit. I have no idea if it comes from right here or not, but I am short as I write this in a short term trade.

Friday, November 17, 2006

GOLD BUGS ALERT

For all of you gold bugs, we are getting the pullback against the trend that is setting up a long entry opportunity. You can either wait for the pullback to get to the lowest low of the last 10 days and just buy with a pre-designated stop, or buy the breakout of the flag.

I prefer buying the weakness, but that is just me. Sometimes you miss trades by waiting for that weakness that never develops.

Wednesday, November 15, 2006

DOW JONES

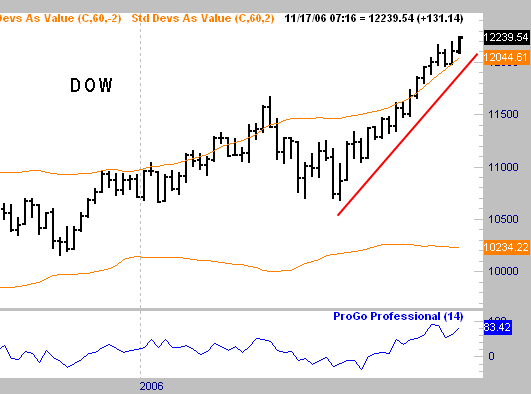
The mid-term election cycle rally is certainly in full swing. As I stated in my newsletter, I have nowhere near the position on that I would like to have had on this move.

However, it is important to stay away from emotional tendencies when these big moves happen. As you can see from this chart the market has moved straight up with virtually no correction at all for many weeks now.

As tempting as it may be to chase this, at times like this you have to remain disciplined. A pullback will occur at some point, and when it does assuming the rest of the internals of the market are still good, it will be a good buying opportunity.

The bond market has remained strong, which is the type of support we want underneath for a trend like this to continue. I am waiting for an entry spot to load the boat, it has not developed yet. It may not develop, only time will tell. We are very extended on a short term basis, so it could happen at any time.

Friday, November 10, 2006

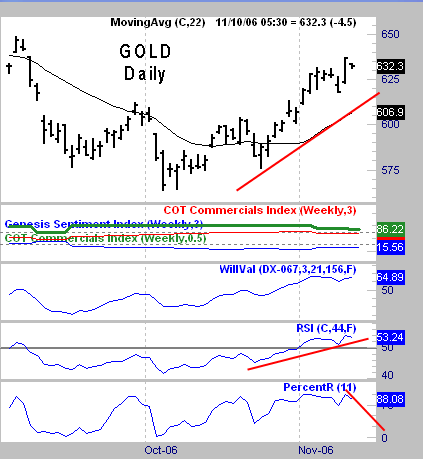
Here is the daily chart of Gold that I refer to in the second post. Now we have an uptrend, so buying the dips is the prudent play.

Percent R is a stock choice for most software packages. If you have it just wait for a reading of 10 or less, and buy the market once it gets to that reading. Use a trailing stop of whatever your risk tolerance allows. It should be itleast $10 due to the volatility of this market, and probably much more.

If you do not have that indicator, all it represents is the close compared to where it is within the range from high to low of the last 10 days. A 10 reading tells you that you are in the lowest 10% of the last 10 days range, hence oversold.
GOLD

I am back from Italy. Sorry for the lack of posts the last week, I had some technical difficulties with the Hotel and their internet access.

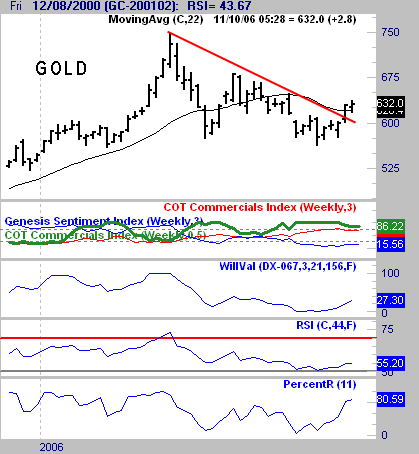
Gold has broken out of its downtrend and should now be traded from the long side. Here is a weekly chart of GOLD as of this morning. The key 574.50 level that I mentioned for closing, did hold.

Next is a daily chart which shows the shorter term uptrend better. Just wait for pullbacks against this trend for entries.

Thursday, November 02, 2006

VACATION

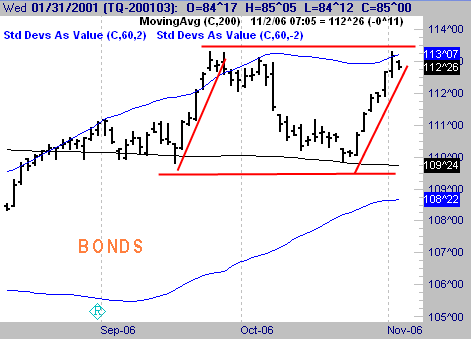
I will be in Europe for a spell so there will not be daily updates until next week. For subscribers who may be frustrated that the bond trading system has not generated many trades lately, I have displayed this chart.

Keep in mind that my goal is not to get every wiggle, although I would like to. The goal is to be consistently profitable. This means at times we will not be in the market. Yesterdays post addressed the trading range scenario we have at hand. Notice now how what I said in my newsletter, written before this happened by a couple of days, has turned out to be true. This recent leg on the chart has mirrored the prior up leg to within 1 tick of the exact price.

Now we are at the top of the range, so why no short for today? Simple, this opening is the type of opening that on average is not wise to short. Due to the overbought situation of the market, this one may work as an entry. However, it is not high probability in my system and as a result is a no-go.

Sometimes the best thing to do is not trade and wait for the right moments. The system actually had a few potential buy signals up here that were filtered by some of my screens for entries. Until next week ......


Wednesday, November 01, 2006

BONDS

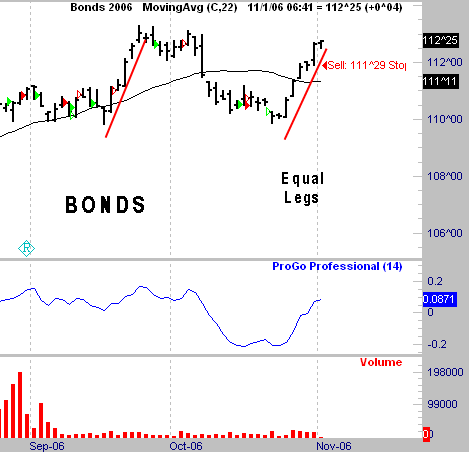
For those of you who subsribe to my services, I made mention in my monthly newsletter about symmetry in the middle of trading ranges. Here you can see how these uplegs look very similar. Trading in the middle of ranges like this is very dangerous.

Often the price swings all the way back to the other side like this, but not always. Sometimes you get stuck in the middle, with choppy action. You can see a sell 111'29 stop indication, which was filtered out as an order for today due to this range configuration, as well as the gap up bars.

I know that someone mentioned they felt rates were going to rise due to a fundamental reason. Who knows, that may happen, but right now they are dropping. Big picture fundamental things are very hard to dial in to short time frames for trading purposes. We are now approaching the upper range, where sell signals will make more sense. Hopefully, my system will generate some sell signals up here against these highs.

If I had to guess I would say that this rally is being generated by weak economic news, but that is just a wild guess.

Monday, October 30, 2006


GOLD

Here we now have a clearly defined triangle on a weekly GOLD chart. I have mentioned for a long time that 574.50 was a key level, and that any close below it would signal the end of the GOLD bull market. We have held that level so far and have bounced up right into the declining top of an obvious triangle formation.

Some gloom and doomers are calling for 35,000 or some such nonsense as the ultimate top of this market. (Just kidding about that number, but the predictions are ludicrous) It is also still undervalued against the dollar on a short term basis (the 3rd graph). If we get a breakout of this triangle on the upside on a CLOSING basis, this market can be traded from the long side on pullbacks.

Do not get tied into this inflated adjusted skit that people talk about who do not trade, as a basis for comparing these levels to historical levels. This is then used to extrapolate prices well into the thousands for target prices. Traders trade on the prices that are here, absolute levels. Economists talk about these other things, while being wrong time and time again in their predictions. Although you might want to keep that rap in your repertoire for cocktail parties and the beautiful women you might want to impress.