DISCLAIMER

PLEASE READ THE DISCLAIMER AT THE BOTTOM OF THIS PAGE WHICH APPLIES TO ALL CONTENT IN THIS BLOG AS WELL AS ANY OTHER MATERIAL FROM WE ARE FUTURES TRADERS LLC. READING ANY CONTENT BELOW CONSTITUTES AN AGREEMENT BY ALL READERS THAT THEY HAVE READ AND AGREE TO ALL THAT IS SET FORTH IN THE DISCLAIMER AT THE BOTTOM OF THIS PAGE.


Thursday, June 30, 2011


SHOW AND TELL


I have not done as much of this in here as I have at times in the past, but I feel compelled at times to show the actual trades I have done to prove that I actually do trade, do make money, and am not some blow hard analyst. There is going to come a time in the future, probably around the first of the year where I am going to resurrect my trading service. At that time for a fee people will be able to get the actual trades I am doing in advance so they can play along. I have had mixed emotions about this because I don't like babysitting people after a losing trade or two. This is a tough business and not every trade works out as well as the series I am going to show today that I just made. However, at times like this past month every trade I do makes a profit, and that is how we get well ahead doing this. You have runs, then back and forth periods, perhaps a losing period then another run etc.. This is how the real world works and it is also how trading works.

When I had my trading service before I had one guy who quit and wanted a refund after I had 22 consecutive wins in it, then took one loss! I am sure he skipped all the winning ones and finally decided to dip his toe in when the loser came around and lost money from a service during a stretch of 22 out of 23 wins. This so annoyed me I gave him his money back to get rid of him, and decided to shut the whole thing down a couple of months later. The public lost out when I did that, but I do not have time to deal with this type of thing. If you are trading and are interested in a service, I would suggest making sure you are well capitalized enough to endure some losses. Even the best traders in the world have losing trades, I sure do. This month of June with no losses is rare, but I do have a good winning percentage so it is the goal I suppose.

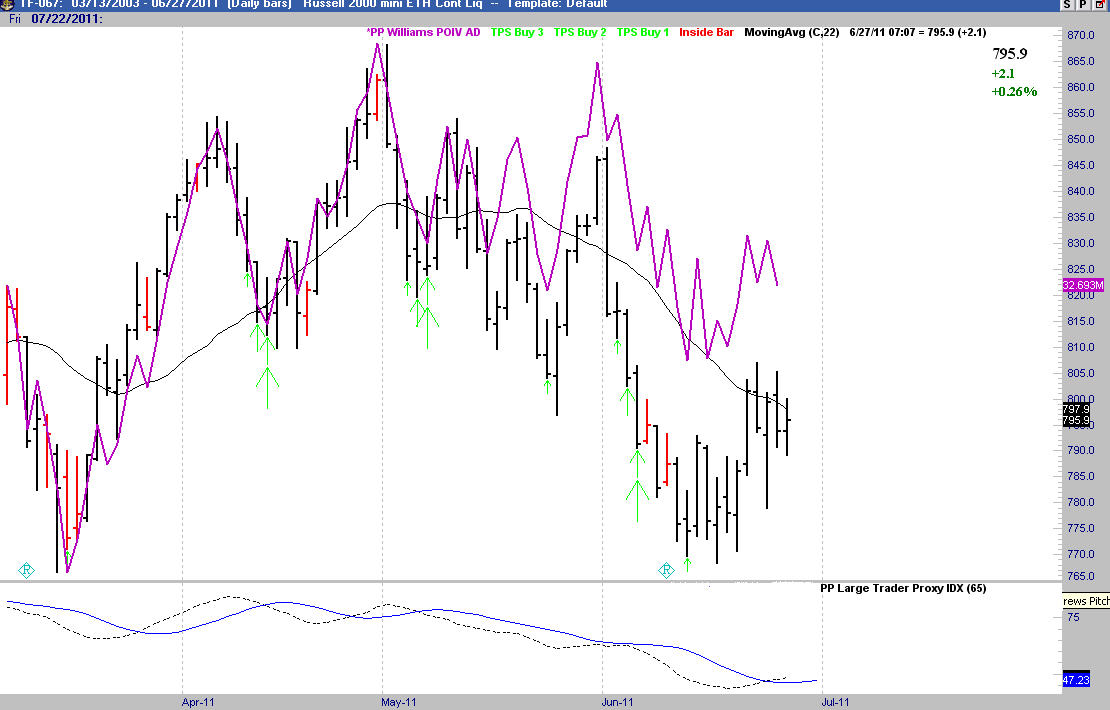
I had mentioned repeatedly in here that the Bernanke's were a buy and the Bernanke 2000 ( Russell ) was the one showing the most relative strength and that was where to play. I did exactly that at the points labeled on the chart. I did have a limit order in at the price indicated on the chart way above to take profits if we got there yesterday which we did not. I exited in the vicinity of the close taking out a good gain. We may still hit that target, but since we are in what I consider a bounce in a downtrend, I did not want to get too cute with this one. We are rising again today which I expected, quarter end etc.. I do not care, I got my money out and that is all I ever try to do. I do not try to pick exact highs and lows, that is a losers game. Please do not feel bad for me I trade enough contracts that this much per gives me enough weekend Nassau money for the golf game. This was a really easy move to spot, I wish they all were this simple. However, I do try to zero in on the ones that are the highest probability with the techniques I use because this is the type of trading I want to do. There is nothing worse than doing all of your diligence, pulling the trigger, then finding yourself in the middle of a bunch of slop sideways chop. I try to ferret out those scenarios but still get caught in some of them in spite of my best efforts not to. What the highest probability is is somewhat subjective. I was listening to a guy on the radio the other day who calls himself the anti wall street guy, I forget his name. He had some friend on the phone who works at a commodities firm and they were talking about high probability trades. All they were were simply their random opinions about support and resistance levels. So they were basically just labeling their opinions as high probability. That is not high probability to me. We need to have quantifiable studies to truly know if the probability is high or not. For all I know these two guys are great traders, but that conversation was ridiculous.

I have mentioned that this is in my view a bounce to short, but we could very well just takeoff again to the upside, nobody knows for sure. I do feel that the 834 area is a good sell zone to be watching for now to see if we get any sign of a sell signal in that zone. I am not going to blindly sell this up there, I will need triggers so I hope they setup. It will be within the next couple of weeks if they do.

I also did the IWM in my stock accounts, which is essentially the same trade as the Futures, just in ETF form.


This obviously is basically the same as the futures trade. I wound up getting in this a tad better than the futures because for some reason it was lagging a little when the futures traded through my stop for entry. Nonetheless more or less the same thing. I also did several other stocks, here are a few of them.


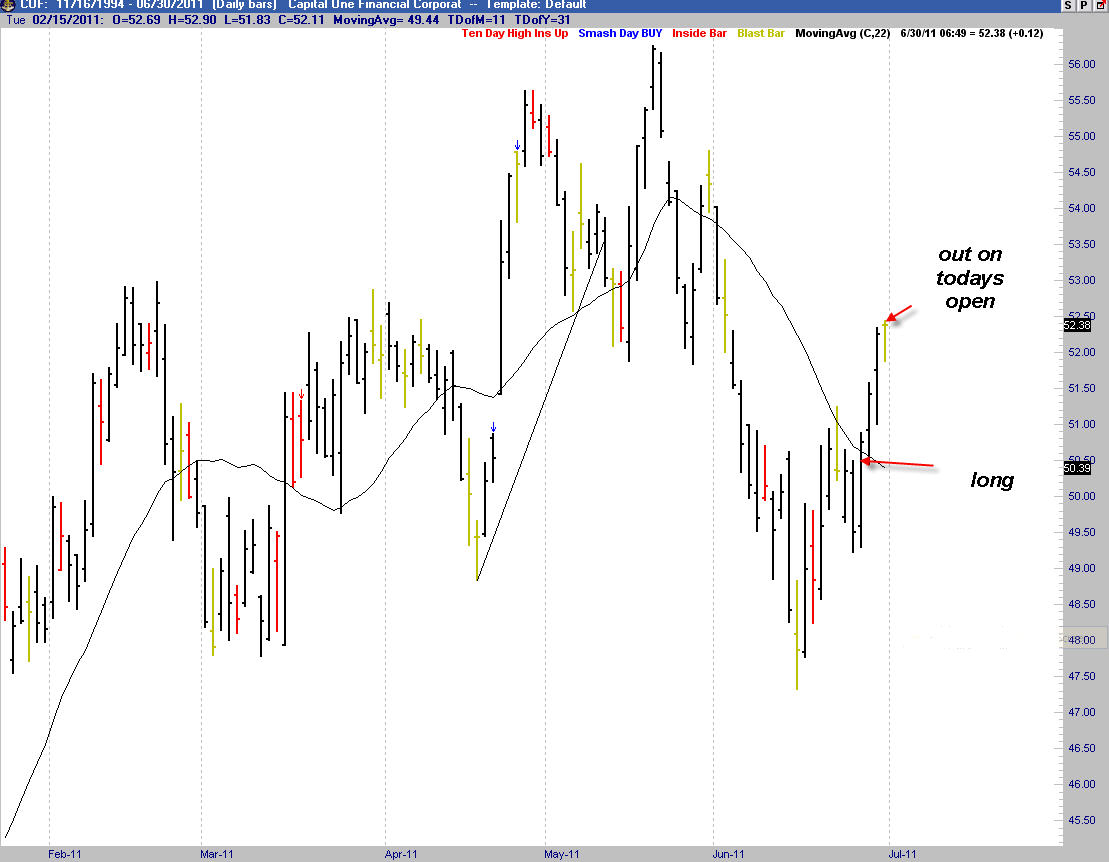
I tried to exit all my stocks MOC yesterday but I was at lunch and using my laptop and this one I did not get to until this morning. I got a better price, so I guess it is good that I blew it yesterday. This is Capitol One and I could care less what my opinion on the company is fundamentally, one of my patterns was here and I was bullish on the overall market, so I took the trade pretty simple. This could have been widgets inc for all I care. It is such brain damage to do what Kramer does and just be hit and miss with all these arbitrary opinions on things. I just don't know how anyone can be consistent doing that.

I also mentioned I did Microsoft.


This one was down yesterday so I gave a little back exiting, so be it. I still caught the two biggest days on the chart, so mission accomplished. There were several other stocks I did, all wins, that I am not going to show it just gets too ponderous. The point I am making with all of this which I did here from time to time, is just to show actual short term trades I execute and what happened with them. I have harped ad nauseum about how the world is one trade and this just shows an example of this. You might be able to pick stocks that will decline during a run like this in the Bernanke's, but the wind is at your back trading with the government and it's little games not against them.

That is it for me I am flat and done trading for the month. I do not know if I will post anything tomorrow or not right now. Enjoy the holiday!

Wednesday, June 29, 2011


LET'S SPECULATE


Since this whole blog is about speculating, I am going to spend today speculating about what is in store for the markets moving forward. One of the great things about software innovations is that we have so many great tools to use. Of course it is also a negative to have so many tools to use because we wind up chasing our tails with too many things on the screen at once. At times price projection from software like this are incredibly accurate, and at other times they are just outright dead wrong. I never hang my hat on these types of things, but if I am leaning one way for some reason it is always interesting to check to see if these projections match my predisposition.

The above chart is that of the weekly Bernanke 500, and I have been consistently stating in here that I thought we would have a bounce, then a larger move down. Interestingly enough, the forecast above does match that. Only in this whacky world we are living in now would a vote in the parliament of a country that is bankrupt accepting a second loan that they have absolutely no chance of ever repaying, be a bullish development for stock prices. If you were a bank and were not forced to do something like this would you do it? Of course not. I also heard some pinhead named Bo something or another on FOX last night screaming at the top of his lungs that all doctors should accept all patients regardless if they have the ability to pay or not. It is morons like this that support business practices that would bankrupt any company, that are pushing us off a cliff. One of my sisters is a surgeon and I have talked with her at times about medicare patients and how they charitably take X percent of them per month, knowing they are taking a huge loss on them, and they do it charitably. However, they keep it I seem to recall at about 8% of their total patients. Who could blame them? I am certainly never going to agree to manage anyone's money that I would have to pay them to manage and get nothing out of it. Who in their right mind would ever done anything like that?

This dim whit on Fox does not seem to understand that in this great world of his malpractice insurance is six figures alone annually, so if you get paid 8 to 10 cents on the dollar, your business goes under immediately. Of course he spoke of no solution, and this dude I think is generally a conservative. If guys like this want things socialized we will be Greece on steroids very soon. I just mention this because it is one of many things that are going on that are going to matter very soon in my view. We are now rallying up into some resistance areas as the month and quarterly end mark up game goes on. I always found it interesting the way funds to the window dressing at the end of the month. They need to be able to show that they own the right stocks on the dates of these cut off periods, even if they just bought them. Investors want to see their fund owns the stock du jour of the moment, the Apple's and IBM's etc. If they look at the funds holdings and see that some of these big name companies are not there and the fund is lagging at all, poof withdrawals. This forces these folks to always have the pretty stocks in the window at certain times even if it means they bought them 30 seconds before the close and have not made any money on them. Aah the world of perception we live in.

Aside from any of the political and economic views that might bias me, the chart above says it all, we are retracing in what I am calling a downtrend now. If this does happen to be another leg in the bull market we will just continue upward from here so we are at an inflection point give or take a day or two. We are bouncing strongly off the 200 day which many people really give a lot of weight to. Place your bets.

The next projection I find interesting because it projects counter to what many people are looking for right now.


This is the pride and joy of our comrade chairman, the 30 yr Bond. Many are saying we have only one way to go here with rates and that is up, since the other day we actually had a negative intra day rate on the one month. On the surface it is hard to argue that unless you are Japanese. If you look at the long deflationary cycle they have been in, the rates over there have had nowhere to go but up yet they have gone nowhere at all. If we do get a stock market decline resumption, there is no way in my mind interest rates will rise. These two markets have a very tight inverse correlation. The one scenario for higher rates would be a huge stock market rally and an economic rebound. If that were to occur, we would likely see rates rise which ultimately would clobber the stock market about 6 months later. There seems to be about a 6 month lag between big moves in rates and when it effects stock prices. I have been looking in the near term for a Bond market decline as I have been mentioning in here which may have begun here in the last 2 days of course opposite the large move up in the Bernankes. I have not shorted Bonds yet.

These two forecasts are in line with what I am expecting, time will tell if they turn out to be correct. I do not trade off these anyway, it is more support of what my other tools are telling me. So far we have a stock decline and bond rally, so what does that mean for Gold? The bugs would tell us if the grass grows or your dog farts that should mean Gold will rally. If there is a sale at Nordstroms, Gold should rally. I have told countless people over and over to research the store of value notion, so if you have not done that it is on you. The projection here shows what I have said over and over.

IT IS NOT IN THE DATA


Here we see just a sideways projection while at the same time a huge decline projection for stocks. This is consistent, there is no historical relationship between Gold and times of strife in the stock markets, NONE. This does not mean it will not go to $6000 like some predict, for all I know it will. The point is that it will not be due to the stock markets crashing if they do. This forecast also matches my view on Gold which I don't really have a feel for one way or the other at this point, so sideways makes sense.

I was reading yesterday an article about the dollar being voted by some international panel of "all stars" as more than 50% likely to not be the worlds reserve currency 25 years from now. Alot of good that will do you today. You had better be damn sure you are right about an investment you are going to hold for 25 years, it is hard enough being right about what will happen a few days from now. Also, during periods of coin tosses your odds can be just over 50%, so this means in the next 25 years you basically have a toss of the coin probability that the dollar will no longer be the world's reserve currency! Boy I am glad I have that going for me.

Tuesday, June 28, 2011


WHAT IS UP IS DOWN


Today I am going to talk briefly about contrarian thinking, but first let me talk about what I have been doing the last couple of days. The above chart is that of Crude Oil and the recent trade I made. You can see where I shorted this on Thursday, and I got away with one here in all honesty. Yes the market cratered and the trade worked out, but I was asleep at the wheel here. You cannot see on this chart, but there was a major low over to the left that I was selling right into that I had not noticed when I was getting into this trade. I often exit against these types of support points, so had I noticed this I might not have done this one. However, I did once I was in and it started free falling. When I noticed the low and we were approaching it I put a limit order in about in the middle of the range of the lowest bar and got filled where indicated for about $3500 per contract. I suppose one could say I got lucky here, but I did follow sound trading principles so I am going to say it was skill. However, I still was not as diligent in looking at this initially as I should have been. The lesson is to make sure not to be sloppy and I was here.

I mentioned yesterday that I was looking for a rally still and we may have started one. The next chart is one of a few stocks I bought yesterday, Microsoft.


Apparently they made some type of announcement, I will let CNBC explain that to everyone, I don't care. This was setup as a buy for me, the Bernanke's were setup for a buy confirming it, so I took the trade. I also took a few other longs in various stocks. I suppose being bullish here is somewhat of a contrarian position, so let's talk about that for a moment. I also mentioned that the Bernanke 2000 formerly known as the Russell, was the strongest index, I went long there yesterday as well.

What is Contrarian Thinking? Obviously by definition it means thinking contrary to what others do. How valuable is this for trading? That depends......

One of the things that I think is misunderstood about this concept is the power of the masses. The masses do drive trends in price, so just taking an opposite position of them to be a smart ass can be a bad idea. Also, even when you are right the sheer momentum of the masses tend to drive trends farther than we can ever imagine they will. You need to have nerves of steel at times to trade in a contrarian fashion. I can assure you that at times you will be wrong and will get run over, it has happened to me. The Metals markets are an example of that type of situation. I was bearish on Gold more than a year ago and just flat out dead wrong. There was every single sign of a frenzy and mania one could ever want in that market. I even had 7 year old kids asking me how much Silver I had bought at a Sunday party! If that is not the ultimate "we knew it was a top" signal I don't know what is. That happened over a year ago. The masses have powered these markets on. Obviously now Silver has made it's top, but look at what you would have had to have taken on in terms of risk, to have shorted that at the highs. Fortunately for me I do not trade on my opinion, and I made money on the long side of these markets even though from a contrarian standpoint, I thought they were sells.

I mentioned that after the top happened a story would come out about a hedge fund manager that made billions shorting that market, so I am sure as we continue down, a story or two will come out. The trick with Contrarian trading is understanding that the masses are wrong at the turns not in the middle, and timing them is not an easy task. I have been having an outer inner monologue on the end of QE2 and the fact that it is such an obvious trade I am skeptical of it. That is an example of contrarian thinking. There are millions looking at that trade, and millions of people don't make profits trading. I am hesitant to go with the masses on what would be a turn here because they are normally wrong at the turns. So how do you know when to go with a Contrarian thought or idea and when not to? For all we know comrade Ben and company have made a back door deal with large funds and institutions that they will quietly give them money, if they agree to be heavy index buyers once QE2 ends. There is absolutely nothing I would put past these guys at this point.

The answer is very simple, follow your rules for trading. I may think out loud like that, but I never execute a trade based on an opinion, EVER!!!! If I have sell signals after this bounce peters out, if it does, I will take them. If I do not I will not. Whether I think the pulling of the rug of QE2 will cause a decline or not is irrelevant to how I will trade it. This is my style and I know what works for me. Chasing arbitrary opinions about deficits, politics, dollar devaluation, is not a way for me to make money and I do this to make money, PERIOD! I would rather stand in the corner and talk about the Lakers at a cocktail party and have everyone think I wash cars, than brag about some macroeconomic view that will make me appear to be smart. I will never forget having some Yenta realtor yell at me at a party back in 2006 when I told everyone all my timing models said to sell all your real estate and that timing markets was what I did for a living.

Of course this was followed by a shout down by some pinhead who is out of the business now, telling me how I knew nothing about real estate, they weren't making anymore land, and that I should stick to commodities. I sold my house 2 doors down about 6 months later making over a million dollars profit and rented for 3 years while this "expert" lost her business. If we take that as an example, look how hard it was to actually be correct about when that top actually occurred. The masses had a huge stake in seeing that continue to move along, so even after I sold at what seemed like the very top, it did not really roll over for more than a year even though the internals deteriorated very quickly. This is a similar situation to what we have at hand right now.

The stock market has been artificially elevated like housing was with again cheap money, sound familiar? At this point we basically have a presidential re-election at stake with the market staying aloft. Barry has done virtually nothing right at all except be at the helm during this moonshot of a stock rally. If this craters, he is done without question. The main reason the PPT has elevated the stock market is that if it were still at 6500 and everything else was as it already is, the public sentiment would be completely different, and entirely negative. They have made people whole in their retirement accounts which makes them less fearful of the bad things that are going on, they have "recovered." The "recovery" is nothing other than a recovery in the stock market, there is no economic recovery at all, that is poppycock.

If we take all this now and guess as to what might happen with the obvious rollover that the end of QE2 should bring, it just makes me wonder why they would allow it to happen? However, make no mistake about it, if I get sell signals I will get short. If you trade based on opinion and not rules, I think you are going to be chasing your tail. Make sure if you are of the opinion that shorting this at months end is the right play, that you are doing it for sound technical trading technique reasons, and not just an opinion about Comrade Ben and what he might have up his sleeve.

CJ OUT!


Monday, June 27, 2011


HAVEN'T CHANGED MY MIND


I am still looking for a bounce, I have not changed my mind on that one bit. The above chart of the Bernanke 2000 shows what is the strongest of the 3 indexes run by the Federal Reserve. If one is inclined to go long in them this would be the one to chase. There is a unconfirmed rumor out there that they are considering turning these back over to the public at the end of this month. What a nasty rumor that is. As Jack Nicholson said in a few good men "you can't handle the truth." It is clear that is how our leaders view on us regular citizens as they just lie over and over again to us. Can we be trusted with such a responsibility as the stock indexes? Is it possible the we the little people can actually handle a free society? Me thinks not.

As we have seen leading up to this rumored handover, the markets have been tanking. I have said all along that trades this obvious we need to be careful with. The most obvious trade in history has to be to short the indexes at the end of June. It may in fact wind up being a good play after all if we rally into that time frame which I think we will. You can see in the above chart, that the Large Trader Proxy has now crossed to the long side, so that should give us a bit of a lift here. The Large Traders are the trend drivers, so once they get long it is usually the side we want to be on. We do now have some overhead supply, so rallies to me are sells after a few days or a week, but we can deal with that after the rally takes place. There is also a month and quarterly end up side bias, that should help us stabilize here at least for the time being.

Lets take another look at Silver, a market that recently I had shown a map of what had taken place in the 80's and how similar this was. You may recall it called for sharply lower prices and we are getting them now. It is yet to be seen if the fraud of this whole up move is being exposed or not. When I see bulls say we could retrace 60% and still be in an uptrend, it makes me think the game is finally over. Keep in mind you pay a 30% premium to the spot to buy coins or the hard asset, so that represents a monstrous loss if you combine the 60% loss with the 30% premium on top of it. Does that sound like a good way of protecting your money? Some store of value that is! Although they say the reason to buy is that it has never gone to zero, and I guess this 60% to 80% loss they are faced with is not 100%, so it is ok. Folks, it is all the same. You can throw a blanket over all of these hype stories on things from the pet rock to the Mazda Miata, to the Internet craze to housing, to Silver and Gold. It is all just BS and in the end the movie always has the same ending. If you get burned by this it is your own fault.


If you look closely at that chart this move down is over $82,000 per contract, and just are just a moron if you have held it this long. When price falls like this there is never a perfect place to get out, you really need to exit on strength. When you see this huge expansion in volatility and price moves up as sharply as this did at the end, you just have to see this as a climax, it always is. if you do not get out at the exact high who cares, it is much better than giving back half your money, that is foolish. This is just the markets giving you an incredible windfall, you need to say thanks and take it. If you have been sold the bill of goods as to why this is just getting started, this will happen to you every time. Those stories are always there at the highs in price of almost anything. Investing and trading is about taking profits and not being greedy. If you have given this much back go look up what greedy means. Hopefully you just have to make this mistake once. Maybe this will re-ignite and make another run we never can know for sure, but you certainly will have plenty of chances to get back in, if the uptrend were to re-establish itself.


While we are on the topic of fraud, let's look at China. This ranks now as the new BS story du jour. The mustard is off the Silver hot dog now, so of course we have to shift our focus on suckering more of the public into a new idea. China is consuming X amount of Blah blah blah. They are going to take over the world as the economic leader etcc.. Now aside from the raw absurdity of this claim by these scoundrels, just look again at the weekly chart of their stock market. Shouldn't this be just a rip roaring bull market? The truth is this is a bigger house of cards than the US was at it's highs. The fraud in their accounting is just now coming to the surface, and they are more highly leveraged in construction and real estate by far than we were at our bubble peak. This is going to be really ugly when it really starts coming down. When coonfronted with these stories use some common sense.


The moral of the story today is, do not get fooled by these shams. These bubbles people inflate to take advantage of you and lure you in just at the wrong time are everywhere. Do your own research and do not buy into arguments with no historical basis in truth. It will not be different this time due to some rocket scientists thesis as to why it will be. Making your decisions based on what historically has been the case may not result in you catching every move, but it will help you avoid these shams.

Good Trading to everyone


Thursday, June 23, 2011


WHAT A DIFFERENCE A DAY MAKES


It must have been bad karma that Blogger dogged me yesterday and would not allow the posting of this chart above. I mentioned in the text yesterday that my COT indicator had reached the sell zone, and today we are seeing an across the board wipe out. I also mentioned yesterday and I will restate the same thing, I have not figured out the best way to use this thing yet. It does pick some moves just dead on balls accurate like this, but at other times it is way early. As with most tools, they area just that tools. You need to determine your own style and how you will use them to trade.

I did find it odd that I was having a hard time finding any individual stock longs to get into during this small little basing period. We are still down now into a price zone where some of the things I watch say to look for a buy signal in the Bernanke's, although it is far from setting up as I type this. Although there was no question you should have been long the Bernanke's going into yesterday, no matter where your stop was you are out now, or short unless of course you are a position trader where you might be stopped below the lows of this last month. I have to admit, the one sell signal I had is not one of the better one's I use so I did not take it. The next chart is one market that I am short, Crude Oil.


Since the world is still one trade basically, this market is going down also along with everything else. Our crazy uncle Natural Gas seems to be holding up the best from the quick gander I took this morning. That market is something else, I love to trade it. It could care less what in the world is going on it marches to it's own tune. I pointed out recently what a great fundamental setup it had for a decline, and it has tanked ever since then so I hope some of the readers got a taste there.

I also mentioned recently that it was time to be looking at longs in the DX and short the currencies, and I was spot on with that. Of course when the Bernanke's go down, so does everything else since this is the concoction they have chosen to create. As to whether this is the big melt down I have been talking about or not, I am not sure yet. Until my short term indicators completely roll over, I am still looking at shorts in the Bernankes into these levels as shorter term trades. If we either decisively break here obviously the game is over, but I still think until we get under these recent lows there is still a chance we are basing for a larger bounce that what we have seen so far. If today and tomorrow close down, yet hold above the recent lows, that will likely be a buy signal for me in the indexes for Monday.

I do want to make one thing clear, any longs I view as short term, I think overall the game is over here for the market as a whole. Whether we bounce first or just roll from here, it is my view that we are going to see sharply lower prices by the fall.


Wednesday, June 22, 2011


WE GOT THE BOUNCE NOW WHAT?

Blogger at the moment will not let me load any charts, and I have lost my patience at this point. Sometimes Blogger just does not work, what can I say.

I wanted to post a chart today that shows that the Bernanke 500 has now reached a point where my COT Synthetic indicator is in the sell zone. As I have mentioned in here previously, one of the flaws with that indicator is that it switches to the opposite extreme too quickly on bounces. I still have not figured out the best way to use it. The weekly target areas I have for shorts are still quite a bit above, so I am not looking at shorting this yet. Even though I am sure Ben is tired of day trading stocks at this point, I do still feel there is no way the Fed is going to walk away from propping up the stock market here. They know this thing will collapse instantly the second they stop manipulating it, and that is bad politics right now.

As a result it would not surprise me one bit if this bounce becomes a ramp up that just accelerates. I only short weakness so if that happens no shorts will be entered. I do not have a trade in either direction in the indexes, but think short term traders should be long right now. As to the Bond market which I have been looking for a short entry, it has been holding strong and I have not done anything there yet. The possibility certainly exists that we are going down Japan's well chronicled road where we will have low rates for a very long time. As we watch the stock rebound, the fact that the Bond market is not declining yet is indicative of strength. When our hero Ben talks today maybe something will change, but it does seem to be an assumed given that what he says will be a lie. Isn't it a sad day when most of the public assumes that a speech by the head of our Federal Reserve will be filled with lies, and further that it is acceptable?

I am flat right at the moment. I have been looking to buy the DX and short the currencies, and do not have any signals yet. I think the metals have now bounced too much to be shorts anymore so it is likely they are buys on pullbacks now.

Sorry for the brief post


Sunday, June 19, 2011


THE BIG PICTURE


I have been reading alot of different things lately for some reason, which I usually do not do. I think the way information is disseminated so widely and so quickly now makes it impossible to just trade in isolation without hearing any one's opinions. I have a link below that I found somewhat interesting. This guy subscribes to alot of techniques and signals that I have not found to be that accurate ( Dow Theory signals for example ). However, the overall price map he is talking about I think it about the same is what I am looking for. His rationale as to how he arrives at these projections is not the same as mine, in fact there is not a single thing he looks at that I use. That does not mean anything, for all I know his techniques are better than mine. It is just a general map that somewhat matches up what I have above here.

This forecast in red has been incredibly accurate over the last few years. Since it is something that was given to me by someone else I am not going to divulge what it is or how it was derived. It does not matter anyway, because the logic behind it actually makes no sense at all to me. What does make sense is how incredibly accurate this has been. I came across this a few months ago, so the recent decline it has called right on the money was known one year in advance. It is one of the things that has led me to say for months that I thought June was going to be a top in the market. When I combined this with Larry Williams annual forecast that has about the same timing, it led me to believe that we were going to see a decline in this time frame.

As it is with all forecasts like this, it is about time not price. The large decline it shows may or may not be accurate, it is the dates that should be. It shows a low point the week of October 7th. Here is how it did the prior period to what I have above.


One thing to keep in mind with this, the points in the forecast are known 1 year in advance. You can see how incredibly accurate this has been. I have never seen anything like this in all honesty, I just wish how it was calculated made sense to me. I believe things need to be conceptually accurate to be usable and this is not really. However, I still am deferring to this until I see it go astray, which it has not. This tells us we should trade down into October, which also is the normal seasonal pattern anyway. The next chart is that of the weekly Bernanke 100 with the bands that are probably familiar to people at this point. I had mentioned a few days ago that we needed to take out the prior weeks high or we risked the trend changing. We did not, so in my mind the trend in the weekly chart is now down. Generally when we get a few bars clear of these bands the trend has changed. During this whole rally off the 09 lows we have never had a period where all three of the Bernankes had multiple bars clear of the bands on the down side.


As I have noted on the chart, we have a couple of bars clear of the bands and have also taken out the prior pivot point in the Bernanke 100 above. You can see the last time we had 2 bars clear, we did not have them clear in the other two indexes (not shown) and we also were holding the prior pivots by a big margin. In our current instance we have taken out the last pivot. This tells me now that the change of trend is confirmed and now I want to sell rallies. My strategy therefore is going to be to try and catch this long this is about setup here, then look to get heavily short once the bounce peters out. I have no idea if this is a world ending wipe out like so many are predicting, or just a garden variety trend change that leads to a move down in an orderly fashion. It is not necessary for me to know that to make money trading. One thing I will state is that for those who look for these gargantuan moves every time they see something that confirms a direction, you have to get with the program. That is an overly emotional view and emotions will separate you from your money in this business very quickly.

My good friend who I have mentioned recently many times is like this. Every time there is a short term signal he views it as a monster move coming. I think alot of people do this. You can make a good living just consistently catching smaller moves. Do not get caught up in the cocktail party syndrome of wanting to be "that guy." The trading landscape is filled with people who wanted to be the guy who predicted blah blah blah. That is all ego and you should chuck that. Who in the world cares who predicted what, nobody will ever predict every major turn correctly. Catching tradeable moves will at times result in you catching big ones anyway.

I don't care one hoot about the conjecture of the Greek crisis as being the catalyst or any of this other crap written by people who do not even trade. I am a trader, so I watch what helps me get in sync with what the next price move will be. Opinons about macro economic conditions are of no value in that regard. I do acknowledge that from a general perspective, these issues are going to cause big problems at some point, so I am not completely raining on the parade.

In summary, the trend has now changed to down so my plan is to look for this long setting up right now as a short term trade. After that I will look for a move down that should be larger. At the bottom is the link to this other guys forecast. He is a gold bug so you know my views on these guys. It may well be that he is using this logic to try and convince people to load up on Gold. I did not read anything else from his site. You all know my views on that so enough said.

Good Trading


Friday, June 17, 2011


HERE COMES THE JUDGE


It looks to me now that we are setup for this rally I have been looking for. I am not long yet, but some of the things I watch not shown here above, are telling me now that we are going to move up some. I have no idea if the bounce will just be shorting opportunity or a bigger picture long that should be held. What makes me lean against the longer term hold is that so many wall street people are out there telling us not to worry, the bull market is still intact, this is just a routine correction. I would have to agree in general with that. So far we are holding the 200 day moving average and the advance/decline line is still bullish. However, we also have the unknown of QE2 expiring. Normally I would not even consider any outside item like that but we are not in normal times.

There has never been a time in history where the government has so overtly manipulated the stock market like they have in the last 2 years. I did not think they could ever pull off something like this to be honest even if they tried. The beauty of it has been that they have made no bones about it openly stating the purpose of QE2 is to raise asset prices. Mission accomplished. The Dems are now using that as a talking point since everything else they have done has been a train wreck. It also allows us to get a peek into what the strategy has likely been all along. This market manipulation was done out of political expediency. I have no doubt had the other party been in control the same thing would have happened. They claim the economy can't be that bad look how much the stock market has gone up under Barry's watch. I just have this lingering feeling the economy is a bigger house of cards now than it was a couple of years ago, and I cannot shake it. The reason I think that is that none of the excesses have been allowed to be worked off. The debt issue is more than an elephant in the room at this point. I am referring to both the government and private debt. All the bad mortgages do matter.

So we know the market rally has been engineered, now the question is how do they continue to do so after QE ends? There is no question if they completely pull all the stimulus the Bernanke's are going to implode almost immediately. This is why in some way I think they are going to continue to do something I just do not know what. If we just watch the tape now we are seeing all the moves to the downside. All the rallies even intra day are being sold. It will always look that way during declines whether they are just pullbacks, or the start of a bear market. We do see a somewhat familiar pattern in my indicator above here, that mirrors what we saw recently. The initial buying that was indicated by my synthetic did not jump start a rally, but now that we are starting to see a drop off in the commercials positions, a rally appears to be starting. One explanation for this whether it is in the actual COT data, or my own morphed one above, is arbitrage. Especially with the Bernanke's there is a lot of cross trading in these so I think that distorts things somewhat. Also, I have noticed at times with the COT data that the actual rallies don't start when they are buying in down trends, until they start to lighten their positions some. Of course it could just be this indicator just is not this good as well.

In any event, we are into weekly support and extremely over sold so I am looking for a long entry in the Bernanke's down here.

Since the world is one trade as we have learned, this also means a dollar decline, currency rally and a few other things. We are already seeing that today with the Euro flying and DX declining. I think they are setting up pullback trades which is what makes me think the Bernanke bounce will just be a bounce only.


You can see here that my indicator was right on target in forecasting a decline. We are at key levels in many places now, so keep your powder dry, big moves are coming our way very soon and I think they are going to be down.

I think the big short is upon us after this bounce plays out. I am flat right now across the board. There is just nothing that is meeting my criteria for a trade at the moment. I have made good money this month so far, so I am not going to chase anything marginal.

Thursday, June 16, 2011


CONFESSION IS GOOD FOR THE SOUL


Here is a trade I made in of all things Rough Rice that I closed out yesterday right before the close, for a very nice profit considering how many contracts I had in this across my accounts. I put this ridiculous Bollinger Band template on here just for fun. I have no idea what any of this stuff is other than obviously I know what his Bands are. I wonder if this trade was justified by this technical stuff?

I poke fun at myself because this is a very thinly traded market, so not the best place to trade. However, one thing I did notice was it was the weakest of the grains I thought other than Wheat, and it tends to form very nice patterns in some of my proprietary indicators. As a result, I took a shot at this one and made about 11k on it.

The confession reference is just that I traded a market that I would tell most people not to touch due to liquidity, so kind of embarrassing, but a good result in the end.

Yesterday was certainly interesting in that we are beginning to see a little panic selling at times for the first time in quite awhile. I made a very large gain in a tick chart trade in Crude Oil when it collapsed. Speaking of Crude, let's revisit that now that once again the Pickens effect is happening again. He was on CNBC last week predicting a rally and boom a crash. He obviously does not make his money from price prognostication, he is the most inaccurate predictor of price in the world. I cannot remember one single time he has ever been on when I have heard him, that he was not absolutely dead wrong almost immediately by a large amount. He owns it and I assume he has an in-house hedging group that makes the trades. If he is making them the hedging operation must lose money. The old adage of never listen to someones opinion about price direction, when his livelihood depends on that direction being necessary for his business to profit certainly applies here. I cannot understand how he is so bad at this, but it is what it is.


The main reason I have been so bearish on Crude is as clear as day on this chart. We had a very unique situation at hand here. If you look where I have the arrow, there was an extraordinary high level of Open Interest which is bearish on it's own. However, if you look at this closely you can also see that the Commercials had a record net short position at the same time. This tells us that the huge Open Interest was not Commercials at all. You can see the record Small Spec long position that was in place right at the same time. When you also couple this with the fact that overall on this weekly chart, the market was still in a downtrend, you really had the perfect storm for a price collapse. When we see something like this generally there will be a large not small price move down. This is why I have been telling people who ask me where Crude prices are going, that I think we are headed back down into the 30's again.

You can see some Commercial buying on the dip that is occurring now which is to be expected, the huge short position is beginning to get worked off a bit by the Commercials. As we drift down this will likely increase and will show them being buyers ahead of when the low actually gets made. On a near term basis this type of buying does justify looking for long entries for a bounce. Of course all of this hinges on the stock market anyway. If stocks rally, this will bounce, if they crater so will this. However, I think in spite of a stock bounce, this will ultimately continue on it's merry way down overall.

The last chart is the result of something I heard someone talking about on the Fox business channel last night. This is a chart of the Bernanke 500 with a 50 day and a 200 day Moving average on it. The technique being espoused was not to ever worry about a bear market as long as the 50 day moving average is above the 200 day moving average.


This theory on the surface makes sense. A shorter term average will be above a longer term one when price is rising and vice versa on declines. However, the big problem with moving averages is they are lagging indicators. You can see here by this logic as a long term investors you really got whipsawed big time by this theory mid last year. You would have exited right where you should have been buying. This is most often the case in these static types of approaches. However, just like anything else, when you get a market that has doubled, any trend following techniques will work. So would having a monkey throw darts at a board. Let's be honest money managers get paid by you having your money with them, not out. Of course they want you to stay in. He was right about one thing, the 200 day. There is plenty of research that supports this benchmark as being a good thing to be aware of. Buying above the 200 day on dips and selling below it on rallies is a proven method statistically to have an edge. As to this 50 to 200 day theory, form your own opinion, but it is way too much of a lagging technique for my taste.

That is all I got today

Wednesday, June 15, 2011


OOPS


As I got up periodically during the night to make sure I did not miss the down moves that happened on my tick chart trades, the overall thought I had was OOPS! What happened to yesterday's gang buster trend day? You can see by the red bars I actually got sell signals right on the last few closing bars yesterday, and down we went overnight. As I stated recently in here, I think it is important that these levels in the neighborhood of the 200 day average hold in the Bernanke's. This overnight debacle in the Euro has bled into the Bernanke futures as you can see above on the 5000 tick ES chart.

I don't know if this is just backing and filling or something more yet. In general intra day price action does not mean all that much, but it might in this instance. If we were going to fire up out of this base we needed to do it now, so this decline better stop about here in my view. I referenced the statistics that say we had a very high probability of over 80% that we would close with a two period RSI reading over 70, which we did yesterday. By the rules of buying into declines and selling on strength one should have been out on the close yesterday.  This is why as a short term trader I am just not completely comfortable with that approach. You buy blindly into a steep decline like this adding as it gets bigger. Then you exit the whole trade on just one up close like that. I just don't like the risk reward in these types of things even though the win percentage is over 80% doing it. In any event, had you done that you made a little bit perhaps depending on where you first entered the position. You may have made some money on some portion of the trade and lost on other portions as you averaged in going down. Not for me I just like to point out different ways of doing things to people.


This is the Euro meltdown overnight shown on a daily chart. I have no idea what caused that you Yahoo or Google finance mavens can look it up. It does not matter to me what caused it, I don't trade off stories so knowing them is of no value. We certainly have a powder keg financially in Europe with all that is going on over there. This currency could collapse at any time it seems to me. I think overall you need to be looking for sells here and buys in the Dollar Index now. How you get into the trades is up to you. I am not in either of those positions yet.

Here is the daily chart of the Bernanke 500 at press time.


I still think on a daily basis for short term trading, this is closer to a buy than a sell, but I have no potential trades here today. You can see what is the significant low that needs to hold over to the left. If we zoom by that turn out the lights, this party is over. Until then I am looking to see if a buy sets up down here, but am doing shorts on intra day trading if they show up like on the first chart at the top where the red bars are.


The soft commodities tend to go their own way and are much less prone to this across the board move skit that we see in most other markets. Cocoa is setting up a buy in my view, so I am watching this market closely right now for an entry pattern. There was not one for today, but if we close down there could be one for tomorrow.

I heard one of the funniest quotes about Barry last night that is worth sharing. "Maybe he should play golf 3 or 4 days a week and work less, everything he does is a disaster?" After I stopped laughing I thought to myself that I have actually tried that during bad trading periods. What happened was I went to the golf club, hit is sideways, shot a bad score, then got more pissed off! Net net that did not work for me, and it did not help my trading either. Barry already seems to play alot and it obviously is not helping him in his main job, so I am not sure with both of us having not had success following that advice, that it is any good.

It is a good idea to walk away at times if your trading is not going well, just don't play golf it is more frustrating than trading. Pick something easy like shooting free throws against Shaq.


Tuesday, June 14, 2011


THE WORLD IS NOT ENOUGH


Once again the market correlations that have been so prominent for so long now (a couple of years), are showing themselves again. I think the next stop now that we have everything in this world in sync, is to somehow get it going cosmic so the universe can be the same trade and not limit it to just our planet. Just our planet alone is just such small thinking we need to set our goals higher!

We get the Bernanke's rallying and it causes a Bond decline. I had mentioned recently that both the Bond market was setup for a decline and the Bernanke's an oversold bounce. We are getting both, of course together, today. If you happen to be in both of these trades please realize they are the same trade, and will trade inversely to each other, so you should have half the risk in each position you normally have to make the total risk in line with good money management practices.

There will come a time when these types of relationships loosen up some, but I have no idea when that might be. As long as it is there you need to adjust your risk and not complain about it being in place. There is a very good historical basis for this particular relationship, so it is not one of the new age Bernanke california weddings that will blow up in short order. Money flows to it's highest place of potential return, and that is why this relationship exists between these two markets. It does not explain why Soybeans rise due to a stock rally. That is absurd even though it has been happening along with everything else in this jolly party we have had going on. The next chart just shows the Bernanke 500 and it's rally today.


I mentioned this was a very high probability statistically when prices are above the 200 day moving average, that when we got this weak there would be a reversion to at the least a 2 period rsi reading of over 70 on a closing basis. This data is from the Larry Connors book on trading ETF's and it has index numbers in there. So we are seeing a bounce now the question then becomes will it setup another short, or is this just another buying opportunity in this huge bull market?


This weekly chart makes it pretty clear for the moment, this is a buy. First off you can see how negative sentiment has gone during the recent decline, and what has happened recently when we have reached these types of levels, big rallies. The small specs have also been short, which is bullish. The commercials have been steadily buying, although I do not consider the COT data to mean much in the indexes now. Monitoring what the big boys are doing in the Bernanke's has not been a good way to make prognostications in the last few years. That data is just on this chart and I did not feel like going through the exercise to take it out. We have also had the advance/decline line holding strong (not shown here), but mentioned previously several times in here. We have an abundance of reasons to be long not short today and probably the next few days.

The one thing I do see here which potentially is a negative is we have popped through the moving averages that have contained this price for quiet awhile. If this week passes without us taking out last weeks highs (I think we will), that would tell me the weekly trend is potentially turning down. When you get a power day going like we have today, it will likely zoom and take out those levels but you just never know.

Net net, at this point I think on a short term basis you should be long stocks and the Bernanke's and short Bonds. I do not know how long this will last. This could be the beginning of another big up leg just as easily as the first move down in a larger decline, there is just no way to tell right here. All that is at hand is a severely oversold market that should bounce and is at this moment. If you are a long term player, there is still no need to panic yet. Life is still good.

We will have to see how long it stays that way.


Sunday, June 12, 2011

SOME THINGS NEVER CHANGE


I came across this chart comparing the last Silver crash to the current market condition, and I thought this was worth discussing. To give credit this is from the McClellan group and it was in a daily letter through Porter Stansberry's advisory service. I have mentioned I subscribed to this to get a regular dose of the doomsday stuff. I always like to hear extremes in both directions on things just to weigh what merit if any they might have. I am not a know it all, so I always want to consider that there might be something I have either missed or misconstrued in my analysis. At the same time you have to have conviction in what you are doing, so I look for the basic thesis of other opinions and evaluate them that way. I do think some of the things these guys are saying have merit, not so sure about some of the other things. They do have a couple of very good writers on their staff, Jeff Clark in particular. He is someone who knows how to trade, he is not just some dumb ass analyst like so many newsletter writers are.

One of the things that is always a characteristic of a bubble that bursts, is those who believe in the bubble not accepting what is happening. If we look back at the Tech bubble of 2000 and the housing bubble, they both exhibit the same thing. The proponents argue when things begin to unravel that it is a buying opportunity, and it is "different" this time. There was a chat portion below this chart in this article and every single comment was critical of the analysis and insulted the author. His basic thesis was that he was not saying absolutely that we would retrace this far, but just that the pattern was very similar and that he liked to use past patterns as predictive of future price direction. This is a very good way to trade and is for the most part how I approach things with a few differences. A bunch of unknown scrubs who likely never made a dime trading just killed him in the commentary. This is typical of when a bubble pops. The folks who have bought the bill of goods don't realize what is happening, and they just give away their hard earned shillings to those who do, and go back to work at Walmart broke again. Please be careful when you read these arguments written by people who don't actually trade about why something should go to a certain price, especially when the arguments are based on something that has no historical precedent. The end of the world scenarios could very well result in metals absolutely tanking just as easily as them soaring. Study history, you will see there is not a consistent relationship.

I really don't have any idea whether or not this pattern will repeat in the fashion shown. What I do believe though is that when we see the type of stratospheric move we saw in this market prior to it topping, we are likely seeing a high made that could last many years. My trading frames are shorter than this type of analysis, but I have studied blow offs for many years, and this certainly had the mark of one and I said so while it was happening. Overall, I think we saw the highest Silver price that will be seen in my lifetime, when that high was made.  That is just an opinion based on observing what Larry Williams calls the Fallen Angel pattern that is in place there. That pattern is characterized by a large spike up then back down. These markets tend to move sideways to down for years after these types of patterns, and that is why he calls them fallen angels. This is a textbook example of that pattern. As always do your own analysis, consider mine, and disregard it or accept it that is up to you. There was a sell signal on Friday in this market that I passed on because one of my filters I use did not confirm the trade, so I am flat in the Silver market right now.

Here is a market that is setup very well for a sell on the weekly chart, Natural Gas.


This is a market that has virtually everything we could ask for. We have very bullish sentiment, huge commercial selling, high valuation, high open interest, and a seasonal bias, all of which are bearish. It is hard to ask for a setup better than this one. Now, a setup is not a trade. I think people get confused watching the Larry TV videos or reading what I say about setups. A setup is just simply a fundamental condition that should lead to a move in a certain direction. That is much different than a trade entry setup, which is a shorter term pattern that is the basis for entering a trade. Natural Gas had an insane 1 minute bar the other day which makes the daily chart bars a mess. This market along with Cocoa are the two that seem to be the most prone to these electronic death spike bars, so you have to be aware of that when trading them. About every few months a bar with thousands of dollars per contract in the range will show up that lasts a minute or so. These bars can clean everyone out. Cocoa is worse, but that one in Nat Gas the other day was a beauty. I do think the way the chart looks that in a couple of days it is possible a sell could setup on the daily chart, so I am watching this one closely.

The Bernanke's are still in the same position they were the other day, just a bit more oversold now. Certainly if you are short it is time to have a tight stop. We may continue to roll over, but statistically there is a better than 80% probability that we bounce at least to a reading the in the 2 day RSI of over 70 on a closing basis. As a result, if I were short which I am not, I would be out at the first sign of trouble ( rally ). My stop would definitely be at Friday's high. It does appear the Bernanke 2000 has become the weakest index, and that is the broadest one. That tells us we have broad market problems here not just a few heavily weighted large caps that are dragging things down.

Talk about a Fallen Angel, how about Weiner? The obvious joke that I cannot believe some comedian has not run with yet is that NY has now taken Missouri's place as the "show me" state.

Good trading to everyone this week

Friday, June 10, 2011

Luck of the Irish


If I go back far enough in my heritage I am actually Scottish not Irish, but the luck of the Irish was on my side yesterday. I displayed pre open where my orders were resting in the lean Hogs trade I have been in. I showed a stop and a limit order for taking profits. I also mentioned that if we closed strong and neither of those orders were filled, I would consider taking profits at the close. I had my plan in place. Here is where I got lucky, my target profit target order was at 93.75 and the high of the day was 93.775. I basically got the high tick of the whole day. When I checked in about 15 minutes before the close I saw I had just been filled. Since I mentioned that I do not death stare trades I am in during the day, I had no idea what this market was doing at all. Of course the one mistake I did make in this trade is I did not get my full size on because it did not pullback, so instead of 10 contracts I only had 7. Oh well, I should have had another 6k on this one but so be it.

I did do some calculating and projecting of certain things to arrive at the number, but this was still lucky. This market may continue higher and make my exit look lousy, but when I get the strong days like this against the trend, it becomes a quick exit from an original hold for the move type of approach. The close was still strong enough where I would have exited at the close anyway, so hitting the target made me quite a bit of additional money. I am sure that some of you got this trade as well, but if you did not, study trap patterns it will be worth your while. Often these trap patterns are major highs and lows in markets, so maybe there will be a buy on a pullback here next.

Another market I have been talking about is Bonds. I continue to look for short entry patterns in this market but the equity weakness is keeping this market propped up. It is still a flight to quality spot and we are seeing that play out once again. I now finally see a pattern that is similar to the Hogs pattern but in reverse since it is a sell and not a buy. We made a new high for the year then quickly reversed, and now today so far we have an inside day brewing. This is not the ideal trap situation at all, so I need more than what we have here so far.


It does look to me like next week we could have something here as long as the stock market does not completely fall out of bed which it could. I still am looking for a bounce there but it feels very heavy right now ,and we are so long overdue for a complete washout that it could happen. I still think we bounce first but who knows. The mustard is close to being off the hot dog right here with the stock market.

The other business interests that I have are in industries that are pretty much core to our country. They generally kind of plod along growing very slowly. However, right now in talking with friends who have interests in the same industry they have all said the same thing. Business just stopped recently. Most said they were plugging along ok until the last month, then all of the sudden they are not getting any orders at all. This mirrors to me what is being bandied about as the overall feeling out there, we are on the verge of another turn down in the economy. It is my feeling that you cannot worry about this or trade based on it. As we have seen in the last 2 years, the stock market can trade in a direction completely divorced from the rest of the economy for a long period of time. The one problem we do potentially have is that average Joe investor can get spooked easily and start pushing the Kramer sell sell sell button.

I did get a call from a friend yesterday who never asks about financial things. He wanted to know what the end of QE2 meant and what was it? He had heard it being discussed on a radio show while he was driving. I explained to him what it was and the two potential scenarios. The first being it's expiration was the most obvious sell in the world and that was probably why it won't crash. The second is that the government can continue to manipulate the markets behind the scenes and just not publicly state it. I told him the safest play for him is just to wait and see if the weekly support levels hold. If they do not he should get out and until that time not to worry about it. That is how the average investor should be viewing this. If we get under the 200 Day Moving Average in the Bernanke's that is when trouble will have officially arrived. I told him to call me if he wanted to know when those levels break. It was interesting the other night to hear the Democrats now falling back on how well the stock market has done as a reason why their plan is working out for all of us. We knew it was only a matter of time before that dailogue started. The question for Barry now is what if the markets roll over, then what? Back to Bush bashing I suspect.

Looking at the intraday charts now, we are seeing a preview of what is to come.

Thursday, June 09, 2011

IN THIS SPORT IT IS OK SOMETIMES TO BE A HOG


In most sports being a ball hog is no good. We see in the NBA that the two biggest ball hogs in the league Kobe Bryant and Westbrook both got eliminated. However, trading is not a team sport, so you need to be a Hog sometimes. I spent all last night sleeping an hour at a time to finally catch 60 ticks on a tick chart trade in the Euro, and now I am exhausted. At least I caught the trade, sometimes with the currencies you miss them trying to do that. They sit still for hours then all of the sudden move and the volume increase does not seem to come at regular times. However, if you are going to use a mechanical method you can't miss trades or you jeopardize the overall performance of your system. There is some judgement in what I am doing, but a very minor amount, it is mostly in the profit taking points not the entries.

The above chart shows my Hog trade I called out in advance, then mentioned after it was entered. Above you can see where my orders are resting for today. I have a target price and a stop price OCO fashion. I also will exit a strong close if we get it that does not get up as far as the target. It would represent 3 good days up in a strong downtrend, so I will likely do that if it occurs but it will be a game time decision.

This is why I like the trap patterns. When they do catch people on the wrong side they move really quickly. They do not all work out this way, not even close. However, if you study the concept I think you will find ways of using it that are worth your while. There is no magic pattern, it is just the concept of a new high or low above or below some obvious points, that immediately reverses in the opposite direction. Larry Connors wrote about it in Street Smarts calling it Turtle Soup. This was an idea to take advantage of the Turtles, who were the Richard Dennis trained traders who bought breakouts at 20 day highs. Larry Williams also wrote about a somewhat similar concept long before that book. As with anything else, there is no exact magic pattern. It is a concept of finding spots where breakouts fail and reverse quickly. There you have your homework assignment.

As the debate about our economy heats up I decided to revisit and old friend, the chart of GM. I was listening to Bob Beckel talk about how great the auto industry is doing and why it was a mandatory move for us to save them. Let me ask you this, does this stock chart look like it represents a company that is doing well? Does it look like a company that can repay us the $40 Billion dollars we have in them? It is my contention this will go right back down to zero once again and be a total loss. Strong unions extorting money from management in deference to a sound business model, is not a formula that works. This is a broken model and will never work. It is pinheads like this that are running our country!


How in the world could someone site this as an example of what a great accomplishment bailouts are? I love the Greek walkouts on their jobs, they are lucky I am not running things. I would go on National TV and tell them to stay home for the next 100 years, goodbye! All of this can only end one way, and rational people all know it. The question is, are we seeing the beginning of that ending right now?


You can see how oversold we are right here in the Q's and I bought some this morning on weakness just trying to catch a bounce. I think if we do get the bounce, we are setting up the big trade of the year which is a short with both hands. The emperor is walking down the runway now for all to see, and we all know he has had no clothes for awhile now. The PPT has been walking along side him holding a blanket up to conceal it. It does seem now that even the mighty Fed will not be able to stop what they really have created by trying to stop it. We are still in an uptrend on the weekly charts, and are in support zones there, so the game is not over yet. However, if we bounce then get a big break it will be. As in the past if they can hold these levels right about here everything is still fine. The question is will they hold? I am not sure but I suspect in the end these levels are not going to hold.

Wednesday, June 08, 2011

TALE OF THE TAPE


I mentioned yesterday that although I am looking for the market to bounce, that the intra day price action has just been terrible and that we needed to have a move down then reversal within a day to show there was a bottom beginning to form. Once again yesterday at the end of the day we had a big rollover. The market spent most of the day in the green just to get clobbered again during the last 30 minutes and close negative. This is what we call the tape. In the old days, even before my time they had to watch tape coming out of a machine that had price quotes on it to watch price action. They called that reading the tape. Of course now with all the technology we have reading the tape is much more sophisticated. We have all our fancy indicators and different ways of forming charts, candlesticks and all this other stuff. Sometimes we just have to sit back and watch the tape.

I do this by just overall gathering my view on what is happening. In this instance it has been pretty simple, as we near the end of the day selling takes place, so the tape is telling is that in the near term the trend is solidly down. We are very oversold, there is no doubt about that, and the philosophy of buying into weakness above the 200 day moving average for the Bernanke's is telling us to buy into this decline. Again, even though I showed a trade like this I did with the Q's I am not comfortable with an unlimited loss in those scenarios when the big one does show up. I think we are on the verge of the big one now, so I am not doing that trade. I do think it is going to occur after a bounce, but it is possible we could just roll over really big right here. Due to how the advance/decline line looks I am not expecting that but you just never know.

The above chart shows the Aussie Dollar long trade I was in that I exited last night. I waited for the NFP report to come out on Friday, before I entered this trade. This market has been one of the strongest currencies, and I knew I wanted to be long currencies, so I watched how this reacted. When the Bernanke's fell out of bed on this and the Aussie only went down a little, I decided on a relative basis it was pretty strong. Since I got it on a retracement, I got more contracts than normal since the stop was smaller. Life was good this thing took off and I was up more than 100 points per contract by the close.

However, as we know things change in a hurry in this business, and they did here. I began to notice that quickly this currency started under performing it's counterparts the next 2 days. The dollar got killed Tuesday yet this went nowhere. I knew I had some trouble so I was looking more closely at it. I then noticed how much the POIV indicator was diverging against the price, so I now had a solid technical reason to back up my tape read as to what was going on here. Once I saw all that and it opened weak in the night session, I was looking for a stop location and I noticed Tuesday was a reversal type bar which gave me the ideal stop around it's low. I got taken out immediately as everything rolled over last night really sharply. I had been carrying my stop at 10582, so getting out at 10670 saved me a bundle of cash since price did wind up going down to where my stop would have been.

Net net, you have to manage your trades as they go along. I had my plan on this one and it was to hold it for what I thought would be a big move up, and it started off gangbusters. The huge equity weakness caught me here, but you just never know when that will happen. I had thought since we are already short term over sold in the equity markets that they might bounce. Had they bounced I am sure this trade would have done well. They did not, and dragged most things down a bit with it including this market. The trade was still a profit albeit a small one, and I managed it perfectly as a short term trader. In the end that is all we can do in this business. The reality of trading is that you just have to grind it out. Many trades work out like this then occasionally you get a big one and all the balloons get released into the air! I may wind up going long again here if things start stabilizing. If equities roll over the currencies are not going to rally other than the DX.

As we have now gotten ever further oversold in the Bernanke's we finally have a chart pattern where the software is projecting an upward move.


I have stated this over and over, these projections based on patterns although incredibly accurate at times, can also be dead wrong. You cannot trade off these alone. I just use them as a general reference to try and tell me a bias when I can't find one looking at the bars alone. It is indicating that past patterns like this have tended to drift up. I still have nothing myself that would get me to go long right here, we just have all down range bars and all my indicators are going straight down. My trading style is not to try to be a hero and buy these types of plunges. There is a statistical edge that is strong is doing so, as long as the Bernanke's are above their 200 day moving averages, which they are in this case. That theory I alluded to above would be long a couple of units so far and looking to add more on a down close today if it takes place.

This is not for me, but I just wanted to mention it due to the strong bias it has if you carry no stops and exit on short term strength.

I did take that trade in Hogs yesterday I mentioned at the end of yesterdays post. I got sidetracked so never got the add ons on a pullback, which never really happened anyway. I only got a 7 lot on, and of course the trade took off. This business can be frustrating in that we don't often have the size we want on the biggies and are too heavy on the bad trades. Now I can root against the trade and have some fun since in this bass ackward business I might feel better if it winds up losing since I don't have full size on it!