DISCLAIMER

PLEASE READ THE DISCLAIMER AT THE BOTTOM OF THIS PAGE WHICH APPLIES TO ALL CONTENT IN THIS BLOG AS WELL AS ANY OTHER MATERIAL FROM WE ARE FUTURES TRADERS LLC. READING ANY CONTENT BELOW CONSTITUTES AN AGREEMENT BY ALL READERS THAT THEY HAVE READ AND AGREE TO ALL THAT IS SET FORTH IN THE DISCLAIMER AT THE BOTTOM OF THIS PAGE.


Monday, October 30, 2006


GOLD

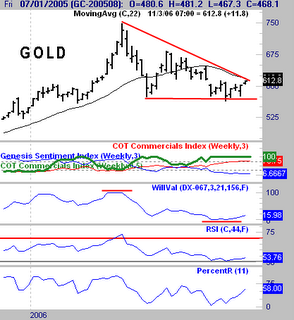
Here we now have a clearly defined triangle on a weekly GOLD chart. I have mentioned for a long time that 574.50 was a key level, and that any close below it would signal the end of the GOLD bull market. We have held that level so far and have bounced up right into the declining top of an obvious triangle formation.

Some gloom and doomers are calling for 35,000 or some such nonsense as the ultimate top of this market. (Just kidding about that number, but the predictions are ludicrous) It is also still undervalued against the dollar on a short term basis (the 3rd graph). If we get a breakout of this triangle on the upside on a CLOSING basis, this market can be traded from the long side on pullbacks.

Do not get tied into this inflated adjusted skit that people talk about who do not trade, as a basis for comparing these levels to historical levels. This is then used to extrapolate prices well into the thousands for target prices. Traders trade on the prices that are here, absolute levels. Economists talk about these other things, while being wrong time and time again in their predictions. Although you might want to keep that rap in your repertoire for cocktail parties and the beautiful women you might want to impress.
Thursday, October 26, 2006

GOLD

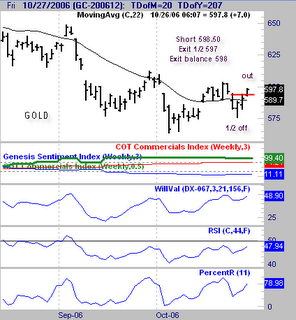
Here is the completion of the gold trade. The remaining contracts were stopped out today at 598 for a .50/ounce gain, essentially just covering the commissions. Remember that more than 1/2 of the contracts were taken of at 597 for a large gain on that portion of the trade.

This is part of money management. When confronted with a large quick gain on a postion, I suggest taking 1/2 or more or your position off for a profit, and stopping the rest at breakeven. This way you have the potential for a windfall on the rest, but are protected in case something like this happens.

NEVER allow a huge gain to become a loss EVER!!!!!!

Tuesday, October 24, 2006

Gold

I pointed out a few days ago when Gold was at 598.50 that it was a short setup. As you can see that trade has a $21/ounce or slightly over $2,000 per contract gain. For anyone who took this trade the stops can be placed at the red lines depending on your level of aggressiveness.

Taking partial profits here would also be prudent if you have multiple contracts. For me the stop is at break even on remaining contracts at this point, $598.

Thursday, October 19, 2006

Time for a little patting on the back - my own

Over to the left is the last update on the Robbins World Cup trading contest which features my bond trading system from the daily trading service offered on my web site.

As you can see, the account being traded there, which features these signals alone, has a nice 46% YTD return. It needs to be stated that the commissions and fees charged in these accounts are much higher than what is normally charged for self directed trading, and represent a drag on the return which brings it down to this level. Most of my other accounts with lower fees have returns in the 55% range due to this differential.

The main reason I have done this was to simply demonstrate out in the open for anyone in the public who wishes to see it, that my trading service does produce profitable trades consistently. I have not traded this to "win" which some of the contestants clearly have. There have been some wild swings in account balances as people have come and gone from this leaderboard. That is too stressful of a way to trade for my taste.

I have used consistent conservative money management to closely mirror what an individual just using prudent risk paramaters could have achieved using this service. There are some of you out there who have traded my service this year that have benefitted nicely from this. I have no idea how any individual might have managed his or her own trades within the signals given. YTD the signals have been 26/34 for 76.4% accuracy and a $5,118 per contract gain.

Tuesday, October 17, 2006

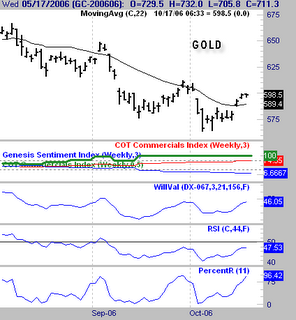
Golden Short Setup

This is not truly Golden it is just a play on words. Here we have a typical retracement against the trend setup. One trend measure that has written about by a few people over the years is just using the RSI and it's absolute value to determine trend.

I discovered this about 10 years ago just playing around with concepts and did use if for short term trading. More recently, Larry Williams has referenced this in his writings. Great minds think alike? Just kidding about that, but he suggests the 44 period setting so we will use that for this discussion.

Above 50 indicates an uptrend and below 50 indicates a down trend. The PercentR is a short term measure of over bought and over sold taught originally by Larry Williams. This tool is part of most software packages for trading. As you can see it indicates an overbought condition in a downtrend, hence a sell opportunity.

Friday, October 13, 2006


Displayed today is the S&P 500 and the bonds. Notice how all the way up during this big rally, the bonds have supported the S&P in both directions as indicated by the lines on the chart, until recently.

Now that the bonds have broken their uptrend, they are diverging from the S&P. It is early in the game for this to be a big problem, but it bears watching. Sometimes these divergences can carry on for months before anything happens like in May when it finally mattered.

However, in July the bonds started bullishly diverging from the S&P and almost immediately the stock market rallied. So, this is something that at the very least should tell folks to cut back their long exposure to stocks and be prepared to get out if we get a break down in S&P 500 prices.

At this point it is just a caution warning, but this rally is so extended that even the election bias is not going to save it from at the very least a pullback. Figure out your own ways of using this tool, it is worth the research time.

Wednesday, October 11, 2006

BONDS

Well things have certainly changed. No matter how we draw the trendline upward it has broken at this point. I had mentioned that I was suspicious of this uptrend but until the trend broke pullbacks were long entries. The reason for that suspiciousness on my part was that we had reached the 2.0 std deviation point at the highs, so we were very extended. This along with the commercials being heavily short were reasons for caution. These influences negated long entries that "might" have generated on the initial drop.

The trend has now broken. It still could be what we call a bear trap meaning this is a sucker move to lure bears in before moving higher, but it certainly does not feel that way. No matter how I test this pattern right here it is bearish. We are getting oversold, so we may get a buy signal here shortly in the trading service.

We do have a strong seasonal bias up for Friday so maybe that will bring a bounce upward, but this market appears to be in some trouble overall at this point. If we continue down, this is going to cause some problems for the stock market. So far we are only at 15 day lows, but if we get to 30 day lows it will be trouble in river city.


Tuesday, October 10, 2006

BONDS

We are precariously close to the uptrend line in the bond market. So far today, we have a gap down that has not been filled. Over time gap down bars are not good setup bars for buys the next day, so I will probably be on the sidelines again tommorrow in this market watching.

I feel it is very important for this market to hold right here. This market has helped propel equites as well as keeping a reasonable floor under the housing market. This certainly appears at this point to be more than just a pullback especially with the commercials heavily short, but technically it is still holding on but by a thread.

Friday, October 06, 2006


Bonds Living Dangerously?

Here is a daily chart of Bonds and the retracement that is taking place. The blue line marks the uptrend, which is still intact. This could just be a normal pullback and my system will probably have buy signals for Monday after today if we close here. I really wanted to short this market today last night, but the pattern just did not line up well enough. When in doubt, I stand aside.

However, for the gloom and doomers out there, if we break this uptrend that will be trouble for the stock market. Lower rates have driven this rally recently, and if that underpinning is removed I think stock prices will drop off.

You can see that seasonally we are due for a little drop here at the beg of October. This could very easily just setup a nice bull flag for a long entry. Let's hope this uptrend holds. The heavy commercial short position is a fly in the ointment here as you can see at the bottom of the chart. They have been early to the party. It will be interesting to see if the commercials have lightened up their longs in the SP 500 on today's report, I bet they have.

Wednesday, October 04, 2006

Is there trouble brewing in Paradise?

There is a trememdous lag developing between the DOW index and the S&P 500. Notice how we are at new highs on the DOW, yet are quite a ways behind the old highs in the S&P 500.

This is a bearish sign for the indexes. I have been looking for a rally all year and we have finally seen one. I had been expecting it to happen later in the year. Maybe this big divergence means we will see a drop off into the fall setting up the real buy point. Notice how closely correlated all the way up to the 2000 high these two indexes were, which is the relationship that should be in place.

However, with the bond market as strong as it has been, a large selloff is not likely. Hopefully this divergence sets up enough of a drop to give us a good long entry for the rally into the first quarter of next year.

Tuesday, October 03, 2006

GOLD

September 29th I mentioned that strictly from a trading standpoint this was a short sale setup and here would have been the entry this morning. I still feel that the fundamentals are a bit mixed in this market so I did not enter this trade.

I do not trade markets like Gold alot, so I want the perfect setup. For those wishing to trade in and out of this market alot, study this setup because it is a textbook flag/retracement against the trend trade.

You just look for established trends, which we have here and wait for a retracement against it up to a 20 or 30 period moving average. Once that setup is in place, just trade the breaks of the lines of the retracments like this one today. You can add a bunch of other "noise" to help qualify these, but over the years I never found any increased accuracy by doing that. This techinique just keeps you in sync with the overall trend in the market and over time is a profitable way to trade.

The only filter you might want to try is only taking the first 3 retracments. Once you get to 4 or more sometimes the trend is getting a bit tired and is due for a change. Just to reiterate, I do not trade like this, but this is a technique I used successfully earlier in my career. There are many traders that are quite famous that trade in this fashion alone.

Sunday, October 01, 2006

The Buck

Here is a weekly chart of the US Dollar Index. I read so many articles talking about the doom of the dollar, yet we look at the chart and we are 6% above the low of 2005. Maybe the forecasters are correct, but we are certainly not in a huge freefall at this point.

Admittedly, I am not a gloom and doomer because I just do not buy into these extreme theories in either direction. There are seasonal decline tendencies in this market here, but until we break out of the downside of this triangle, the short term trend is up. Longer term, we are still underneath the trend down off the highs of November, so essentially in a holding pattern right now.

Sometimes when I am confronted with extreme predicitions I try and imagine what the world would be like if they are true. If I can imagine it then I give them some credence. If I cannot then I just brush such theories aside. The huge dollar decline theories are hard for me to imagine in this way for some reason. This does not mean we will not go down, but some of these huge % drops I read that are forecasted seem a bit out of whack to me. The Fed so far seems to be managing the housing slowdown pretty well, so I do not see why they cannot do the same if the dollar begins to drop quickly. In any event, the chart above does not show any immediate danger unless we break down below the recent up trend line.