DISCLAIMER

PLEASE READ THE DISCLAIMER AT THE BOTTOM OF THIS PAGE WHICH APPLIES TO ALL CONTENT IN THIS BLOG AS WELL AS ANY OTHER MATERIAL FROM WE ARE FUTURES TRADERS LLC. READING ANY CONTENT BELOW CONSTITUTES AN AGREEMENT BY ALL READERS THAT THEY HAVE READ AND AGREE TO ALL THAT IS SET FORTH IN THE DISCLAIMER AT THE BOTTOM OF THIS PAGE.


Friday, December 31, 2010

HAPPY NEW YEAR


Since I have a fair number of readers around the world in different time zones including Australia, I thought it was fitting to salute the New Year even though it has not happened yet here in San Diego. What a beautiful sight the photo is.

I had intended today to do a review of my calls for the year from January, and cannot find them for some reason. I went into my posts from January and did not see them so maybe I did not proclaim any divine wisdom to be measured against. It is my nature to pop off at times so I am surprised I did not do it, but I will self critique the ones I know I have made throughout the year.

Blunder # 1

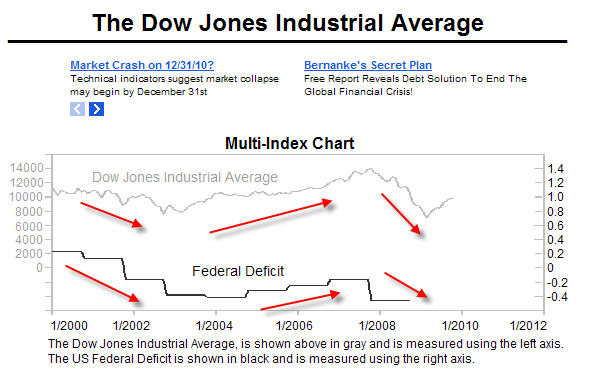
My initial blunder of the year had to be my underestimation of the ability of the Fed to influence stock price direction. In as much as I rail on this constantly in here, and have been aware of this for years, I have never seen their activity be able to drive prices this far for this long. It is generally easy to see when they are active just looking at intraday charts. You can also go online and find when the POMO is being done. However, in the past they have not been able to reverse big trends. At times they have not even been able to slow them down. The reason the Fed along with a few other players are referred to as the PPT ( Plunge Protection Team ) is that the alliance among them was formed to intervene when plunges were happening to shore things up. In the past we have had such heavy volume during downward moves, even they had a hard time containing them.

What has happened this and last year is that the volume has been light, and they have more "liquidity" than at any time in the past. The result, is that they have a very tight rein on exactly what moves where. I have read one of my original mentors comments throughout the year on the Fed, Kevin Haggerty. He was the one who taught me about the PPT. Even he has underestimated their ability to control things this year, and he has been watching this for quite a long time. This makes me feel a bit better.

The one potentially interesting development coming in the new congress is the possibility that certain new anti-fed folks are going to now be chairing committees that deal with the Fed. I would urge them caution. Once they force them to open up their books, they are not going to like what they see. I doubt they are going to want to take the political hit that will accompany a stock market crash. That is exactly what is going to happen if they force the Fed to stop what they are doing. Be careful what you wish for so goes the saying. it is true that the manipulation they are doing is not right, but they have saved millions of people alot of money in their 401k's and I doubt the average person objects to stocks going up every day. Why would they care if the Fed is artificially creating it, a gain is a gain. In the long run eliminating the Fed like some people want is a can of worms that nobody in their right mind would want to preside over. You would have to reset currency prices, and that is an absolute disaster on steroids.

A time of reckoning is going to come for stocks, and there are some longer term cycles coming due at a couple of times this coming year that could give us the sell spot for the ages. We will just have to wait and see if things develop in sync with those dates when they arrive. Until that time, I think even though we will have a couple of sharp declines, they will be bought by the PPT and the market overall will be ok.

BLUNDER # 2

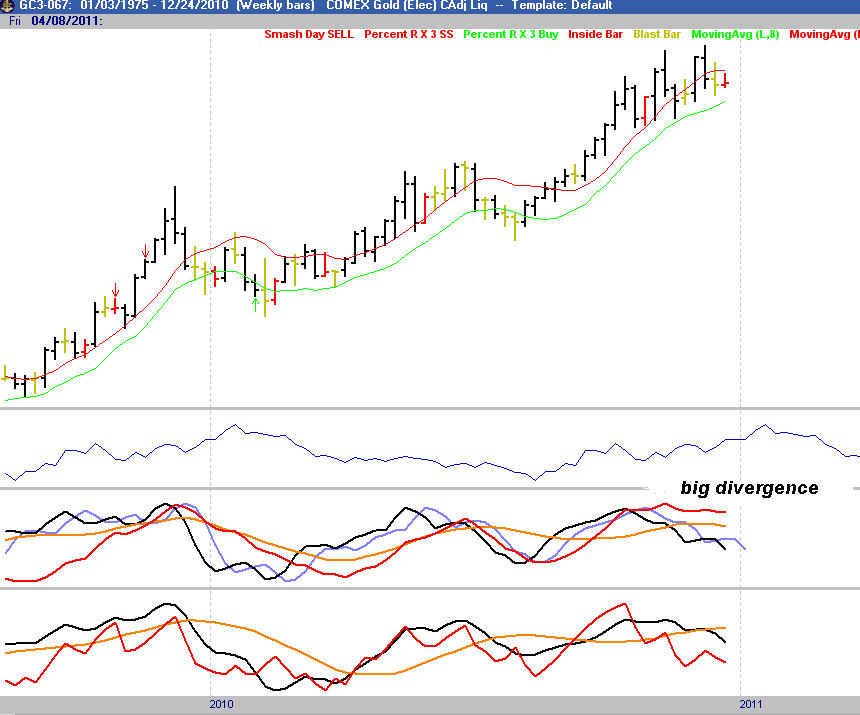
My assessment of the GOLD and SILVER markets as a bubble. As with any asset class bubbles, timing their deflation is very challenging. I should not have been so vocal about this pending implosion, I was just dead wrong. I still feel my view on this is correct but it is anybody's guess when this game ends, and I don't see it in the immediate future. I do see short term sells coming in the near future, but it is not clear to me that will represent a long term top.  My whole basis for my view on this being a bubble has been based on the drivers of this rally being individual investors and historically that has meant huge debacles. In this market this has not occurred in spite of record levels of Small Speculator longs at times. This still puzzles me but it is what it is and my call for a crash here was wrong.

Ironically I have made a good amount of money in this market this year trading it, so that is really what matters. Opinions are for cocktail parties anyway.

Now to some good things from this year. Readers know I am heavily into saving animals specifically Saint Bernard's. Here is a photo of one we just rescued from a place in Phoenix. This poor guy along with two brothers were in a house in LA where their owner and elderly guy died, and they did not find him for 10 days. The three dogs were in the house without food or water for that long, then defending their owner as is their nature, attacked the animal control people when they came because they did not want them to get close to their owner. They deemed them hostile dogs that should be euthanized. The heirs to the estate contacted the breeder who also had no use for them and designated them for the same fate. The rescue people found out about this and contacted the family offering to take the dogs and find them homes at no charge, and the heirs refused saying put them down.


The heroic woman who runs this rescue sued the estate to block this, and won and got the dogs. She will take care of them for the rest of their lives if they do not find homes. Once my wife saw this photo on the web is was all over, so she drove to Phoenix and brought him home. We had to pay for a couple of surgeries for his eyes, and now he is healthy and will be a great dog for us. This woman is what a hero is, not some dumb NBA player who makes a free throw that wins a game. Also not some dilinquent football player who makes a tackle on a kickoff and dances like he is on dancing with the stars, then goes back to the sidelines and sits for most of the game.

What is the whole point of this? I got a bit off center in my trading for a time this year, so I backed off quite a bit and focused on things in life that matter like this to put it back into the proper perspective. Things like this are what makes life to me worth living. If you find yourself in a place where you are feeling sorry for yourself because you got beat up in the market, take a step back. Help an elderly person in a parking lot, do something to give back to the world. I think it will make you realize you need to be thankful for the good things in life you do have and you will get yourself more grounded. This will lead to better decisions. Of course I have to make some money trading to pay for all of these things, so here is what I am looking at right now.


Here is the Bond market that I feel is setup for a rally. We had one false start the other day that I mentioned where I took a swing a missed. I got out of that trade quickly only losing about a grand, which is a rounding error for me so not a big deal. I did take a second swing at this one earlier this morning on the long side. This prominent POIV divergence should matter at some point, it rarely gets this type of look. We do have a strong seasonal down bias that comes in at the beginning of the year for Bonds, so I have no idea if this will go anywhere but there are other things in play here that should result in a rally here.


This is a weekly chart that shows a couple of things. First, the valuation vs Gold. You can see when we reach the undervalued levels vs gold we get rallies, and we are deeply into that zone now. The red line is something Larry Williams brought to the attention of his students recently. Since it was his notification on this, I am not going to show specifically what it is. The hint I will give is that it is derived from the COT data. You can see also that in the past when we have reached into this zone this market has rallied.

The last chart I am showing is just one of many that look the same right now. You will see a nice rally into new highs, that is right into a seasonal peak period. I just think it is prudent to be aware of this and a very good friend just reminded me of the seasonals which I had not been watching very closely in recent months.


This happens to be Soybean Meal but it could be just about anything, many markets look like this right here. I do not see a sell signal here, but I did pass on a buy today due to the seasonal coming due. Time will tell if that is wise or not. The dollar is getting clobberred today which is helping lift almost everything right now. I am going to be looking for sell signals in many markets in eary January due to this above type of situation.

Last word for the year. I am going back into managing money partnering with a very good friend and exceptional trader. I will provide more on this at the appropriate time. It takes awhile to put these things together. Until that time it is business as usual. Once the CTA is operating it will effect some of the commentary in here due to all the ridiculous rules the NFA has. Once the web site is done there will be links back and forth to this blog, and I will continue to provide regular posts.

Happy New Year to everyone and best wishes for a prosperous 2011. Thanks for reading.

Thursday, December 30, 2010

WONDER WHAT LINE HE IS ON?


I remember when the great one was running his campaign and pledged to go through the Federal Budget line by line in an effort to eliminate wasteful spending. The thought occurred to me this morning that I wonder what line he might be on now after 2 years? Is he still in the preface? Perhaps the Table of Contents? I think he just did a Select All, then clicked on increase then hit save.

As you can see from the chart above that I fished out on the web just to show a quick snap shot of things, high deficits are not bad for stock prices. You can see in the last 10 years how clear it has been, when deficits rise so do stock prices. When they decline, along come stocks. This is where people who study economics and try to apply those principles to stock prices get lost. Deficit spending has becomes stimulus for stock prices. When they are injecting money, that money goes to where it will get the best return, and that is often stocks. At times the PPT makes another spot more attractive like real estate for example, or the metals in the last few years. When you can borrow money cheap and invest it and make more, that is basic economics.

If you research the great depression you will find that we actually had a surplus for part of that period of time. Most people would not expect to find that I bet. I am not arguing that deficits are a good thing, they are not. However, this is a trading blog so the point I am making here is that you should not get too bearish on stock prices or the market as a whole just because our deficit is increasing. It really does not have a correlation, or if anything, it is in the opposite direction of what is commonly espoused.

That being said, I am as readers know, bearish for January in quite a few markets. I do not as of yet see a trigger to get short the stock indexes. There is seasonal down bias as I have been discussing in January and the first pocket of that seems to be at the end of the first week to the beginning of the second week. That is a window to look for a sell pattern if one has not developed already. January has not always been a seasonally weak month, that is a more recent development. Seasonals like all cycles tend to move around some, so you have to keep that in mind.

So Goes January, So Goes the Year


Here are the results in the SP 500 since 1988 buying the market on the first day of Feb, if January closed up for the month and exiting at the end of the year. This is the so called January effect and you can see that this has been a good harbinger for the year overall. What is also interesting is how small the draw down max is on the winning trades. Even the largest loss is not that much at 11k considering this is just holding for a whole year with no stops. In summary, I am bearish for January beginning at about the end of week 1.  That is a short term bias and I do not know if that will be correct, or even if it is, if there larger implications. However, if the month does happen to close up, the longer term view has to shift back to the long side.

Do your own research on this it is worth the trouble.

Wednesday, December 29, 2010

NEVER SELL A DULL MARKET?


This is an old Wall Street saying that gets thrown out quite a bit. You can see 3 distinct dull periods where the price has just continued to creep higher. In this case obviously shorting would have wiped you out. It is the nature of price up trends top behave like this. They tend to just stair step upward. Downward moves tend to be faster and more violent in nature. This is why short term traders like me love shorting because you can make more money faster. This does not mean you should have a bias, that is a major mistake. Short only funds have been killed this year, and long only funds get killed during declines. You need to play both sides of the market, but you also need to understand the differences in the nature of price moves.

Let's say you had a negative bias in stocks due to the feeling or even objective analysis that you do, that told you the stock market is likely to reverse back down. You would then go to the chart to see where to go short. There are certainly plenty of divergences in the momentum here that you could have justified taking a short position. However, what I would recommend, is requiring a substantial trend change in the price before doing so. That has never happened in the above chart, so at the very least you would have stayed out of trouble. There are always bad periods, times when you just can't get anything right. I have had one of those this year. It is imperative that you keep your draw downs low. I have kept mine under 12% during one of the worst periods of my career, and believe me in the overall scheme of things, that is nothing. One of the ways I have done that is trying to stay clear of some of my signals that have occurred during this recent upward run.

There have been sell signals in my short term patterns. I have taken them with smaller size and quick exits due to not everything being lined up perfectly. You could argue, well why wouldn't you just wait for everything to be lined up? The answer is a trade is never perfect, the ones that are seem to be bad trades. We are basically probing for a move when the evidence leans in one direction. If the evidence was always air tight for trades, all traders would be mega rich tycoons and the CSI labs would be out of business also. It is not a perfect world and there is no "perfect" trade.

If you can keep your losses limited during bad trades or bad periods, the good periods will take care of themselves. I will admit that as per my recent posts, I am getting bearish on stocks right here and I am chomping at the bit to participate in what I think is going to be a decline in January. However, I also know that so far there is nothing in the price structure to support my view, hence there is not a trade here. At the same time, I do not see a buy signal. Even if I am expecting a decline, if a valid buy signal shows up here in an uptrend this strong, I will take it without hesitating. My view on a decline could be wrong, and who is to say we don't go all the way to QE 10 with the FED which would probably take us to 20,000 in the DOW. They have shown they can completely lift the market in spite of all contradictory influences, so don't be a fool and fight it. Make sure the price action ties into your overall view, then enter your trades.

The next chart is an example of where I had a bearish view on the market and waited for price structure to come in line with that. It is one of the best trades I made this year. You can see how much different this overall picture is than what we have going on right now.


Price here was obviously in an overall downtrend and you can also see the sharp declines we had during this period. You can certainly make alot of money during these moves if you can catch them. However, I think you can clearly see the differences in these two charts and why I am telling you to make sure price action ties into your directional view. Fighting trends no matter how fancy your techniques are, is a very difficult way to make a buck or even keep the bucks you have!


Tuesday, December 28, 2010

THAT OLD FAMILIAR FEELING

I heard this morning that the bullish advisory levels have reached well over 60% again.

This is hardly a news bulletin. What also is not a news bulletin is the explanation given by someone from an advisory firm about why that does not matter this time. In other words, "it is different this time" the dreaded 5 WORDS.


You can see from the Nasdaq weekly chart below, that when we have reached these levels in the past generally there have been declines that have followed, or sideways action. The commentator mentioned some odd stat about how the percentage of households that own stocks was lower than at times in the past which is why there was plenty of room to run. Of course this could turn out to be true. However, the sentiment indexes are of professional advisers not individual stock traders. This is quite a bit different in my mind. The small investor does not drive the market, large institutions do. It is when the advisers are overly bullish that these levels mean more as a contra indicator.

Larry Williams has just come out with his annual forecast, and while I will not give all the details since it is a pay per view report, I will say that it shows a lot of bearish setups right now or in January. This ties into what I have been discussing in here, January after the first few days of rally, should setup some nice selling opportunities in quite a few markets. The first few days of the year should feature new equity flows into funds and support the market in general. After that, I think we are going to give way to some selling pressures probably for a month or two.

I mentioned the other day that I felt the metals were setup for a decline and that I was short GOLD. I also mentioned I had no expectation whatsoever in the trade, and it was simply a signal so I took it. After watching it test the 1372 area twice and bounce, I bailed out of it for a scratch. The entry pattern had been an inside bar with down close, which by and large is a crappy bar pattern to sell below. There are always exceptions in that some of these work, so I still took the trade. However, knowing the pattern was marginal, I kept a very short leash on the trade. I have a close friend who was also in the trade, who reversed to long and is making a nice gain on that move. I did not see a buy signal, so I did not do that but wish I had.


There is no magic to the two bounces, this was a complete judgement call. This market is still in such a big uptrend, I just looked for the first sign of trouble and deemed that to be it. Silver is soaring today and it did have a higher short term low so I guess that is where I should have been long but I am not.

I did try a long side trade in the bonds yesterday that I exited today for a small loss. When I saw it quickly reverse back down today I bailed out quickly. I do think in general this market is in a buy zone, but the pattern is not quite right. I forced an entry yesterday and when I do that it usually does not work out too well. I am also looking to short Heating Oil, but again the tape is awfully strong there so not sure where I am going to get into that one quite yet. I expect stocks to remain firm through the balance of this week. Any dips will be quickly bought just like we saw yesterday.


Sunday, December 26, 2010

INCONSISTENCIES


As we sail along waving to the crowd celebrating our huge recovery and looking forward to a "boom year in 2011," I find it troubling what I am about to discuss. When I do my weekly analysis, I am finding alot of markets setup very bearishly. The only bullish setup I see is the Yen which is a contra to the US stock market generally speaking, having been a flight to quality spot recently. This should not be the case with this perfect storm the fed has concocted. We should be seeing a major inflation wave ( what they are trying to create ). There is one occurring right at the moment, but it is beginning to look like this will end the way all other artificial moves have happened in history. Prices historically have reverted back to the mean, an almost statistical certainty once you get extended as far as we are now. See housing of 2005 for a prior example. It is of course our challenge as to how to time these reversions.

With all the analysts calling for these huge equity moves next year, some even for new all time highs in stock prices, we should be seeing a plethora of explosive buy setups. I did not find one single one of those in all the markets I looked at. The above chart is COPPER and you can see how closely this has resembled the stock market. This is an industrial metal that does track stock prices closely. Look at the huge Small Speculator longs in this market ( marked by my red arrow ). This is also accompanied by a big increase in commercial selling, taking the short position to the highest level we have seen it since 2005. It is often somewhat normal when a big rally begins for the commercials to get immediately heavily short due to their hedging activities. Once we get longer in the tooth in a rally, it is a little different. From a hedging standpoint you could certainly argue that this also makes sense since they are protecting a huge windfall.

However, you could also argue that keeping a lid on prices is also in their best interest, which is another way of explaining commercials heavily shorting once a run gets going. Here is the closest prior example I can find where commercial activity was similar to what we have here in the above chart, with the small specs also heavily long. It actually happened at the end of last year, hmmmm....


It is certainly interesting to me that this happened at the same time in the year, but that may not be significant. You can see the last time we had this setup, we got two sharp declines. This market will not decline unless the stock market does. We have a showdown setting up. We have the Fed putting money into the stock market on a daily basis through POMO to make sure stock prices keep rising. I have stated repeatedly, that they have been able to drive this due to the volume being light. We have a very big volume source in the opposite camp of them now. This is a showdown coming, fundamental forces vs government intervention forces. Who will win? So far the FED is rolling every competitor that challenges it like an Old Nebraska football team. Just running the ball up the middle on every play for one first down after another. However as we all know, Nebraksa's offensive strategy ultimately ran into trouble when everyone figured out what they were doing, sound familiar?

What I have stated repeatedly, and you can find your own historical examples of this, is that when markets get extended this far, the reactions will be equally large. I also see in my perusal of the markets, that both Gold and Silver are now setup again fundamentally for declines. Since we know these track stock prices very closely nowadays, this is also a bearish development. We are now seeing some pretty prominent divergences in weekly charts, that have not been there at all during these huge rallies until now.


That is a good amount of divergence now in the momentum indicator. You do not just go out and short a market due to something like this, but it is an early warning to be on your toes. The next chart is GOLD and you will see an even bigger divergence here.


This has been the weakest of the three metals, and it is no surprise that it has the largest divergence. This is the one to short if you choose to short the metals.


I also think the Canadian Dollar is setup very bearishly, in a similar fashion to Copper above with the difference being it has not rallied anywhere near as much. The Swiss Franc has a very bearish setup as well.


This is a triple divergence potentially, a very powerful sell signal that seems to be forming. I could go on and on, there are many markets setup for sells. Crude and Unleaded Gas have been commercial selling going on. It appears in summary, that we are about to get an across the board decline. I doubt it starts before year end, but in case it does this week be ready to go.

We should see some sell signals trigger in the next couple of weeks, it is yet to be determined if they are just minor or major in their magnitude or duration.


Thursday, December 23, 2010

WINDING DOWN


I mentioned the other day that GOLD was setup for a decline. You can see where I went short in this market today. As per the usual, I have no expectations of any kind in this trade. It was a signal so I took it. As we wind down for the year, the markets do generally tend to get pretty quiet. However, I have seen some large moves happen during the last few days at times, so when signals show up I do not pass on them just because "I think" it will be slow. The odds are it will be but you just never know.

I was reading about how China has been a heavy buyer of GOLD as a reason why the price has to keep rising? Why? What if they have bought all they are going to buy, couldn't that then mean an absence of buyers? What if the PPT decided to combat them by shorting GOLD in record numbers to drive the price against them intentionally? The point of this is just this, it is all random opinion as to how it will effect the price. It is also irrelevant to short term traders. Even if you dial in exactly on this type of analysis, timing such things on a daily basis is impossible.

From this chart above I see both a downtrend ( short term ) in price, and a longer term downtrend in momentum from the oscillator, confirming the price. This together means to me I should be short so I am. The very high correlation between stock and gold prices probably means this won't go far, since it is unlikely we will get a stock market break here, but at times these two markets can separate. The next chart is that of the NAZ, which to me is jumping out as the weakest of the 3 major indexes.


This is developing into quite a bit of divergence here and now almost of the variety that it is worth taking a counter trend shot. It is my hope it keeps building the last week of the year setting up a January entry. However, things rarely setup exactly as I expect even though I always hope they do, so for the brave, taking a shot now is not a terrible idea. We do have the year end markup which I think is going to trump any sell signals, so I would suggest smaller size on this trade if it is done this month. I am not a big fan of shorting below the low when the market is in open water like this, but occasionally you get a top right on the money doing it. Generally it favors waiting for some type of price action that tells you at least the uptrend is flattening. The worst thing that can happen is getting one of these right because it reinforces a bad habit, then you get run over the next several times you try it.

There are those that say that as go the techs so goes the market. Although just anecdotally, I tend to agree with this, I cannot find any research that actually backs this technically. There are some very good traders who swear by this adage, tech leads. If that is true, the NAZ being the weakest of the indexes adds some fuel to the fire for a coming decline. However, even though it is relatively weaker, it is far from weak so I guess that is an asterisk. If we have a pullback, and this declines more, that would be more meaningful that what has happened thus far, which really is nothing.

Wednesday, December 22, 2010

SENTIMENT, IT'S MY OPINION!!!!!........


There is starting to be some talk about excessive bullish sentiment on the stock market. I have to admit at this point it is hard to find a "analyst" who is not wildly bullish on 2011 on stock prices. There are those who would then argue that is a reason to be very wary of prices. In theory if everyone is leaning one way who is left to chip in to keep that going? Tom Demark, one of the great futures trading analysts wrote in one of his books that prices stop going up when all the buyers have bought, not when all the sellers show up. I suppose this could be a play on words, but it does make sense. At some point when there is no money left to keep pushing a move in either direction, a change will occur. It is how to gauge this that is the challenge.

If you look at the above chart of COPPER you can see two periods where I have marked with horizontal red arrows, where Sentiment was excessive for extended periods of time and no trend change occurred. This is typical and is the reason why there is no magic number on Sentiment that screams buy or sell. I do have one spot marked with a vertical arrow, that represents a better way to use Sentiment. We were moving up in a strong uptrend, had a retracement, and Sentiment got very bearish with the trend still intact, albeit barely. It is excessive sentiment in situations like this that is more meaningful in my view. You can see at the far right side of the chart, that Sentiment has once again been pegged at excessively bullish levels for a few months and prices have marched higher without missing a beat. Had you been shorting this market due to this you would have been wiped out by now.

The next chart of the SP 500 shows the same thing. You can see that the best way to use the Sentiment is when it goes against the current trend on pullbacks. I like the quick switches where it quickly moves to the opposite extreme. I have marked off a couple of these. Quick changes against the trend although some do work, are not as reliable.


My apologies after 2 hours of trying to finish this post with the poor Internet connection due to rain here in San Diego, I am giving up. Satellite Internet does not work when it rains and I cannot get a connection to the Google servers that will allow me to post any charts. I was lucky to be able to get the first one in. I will complete this tomorrow when the forecast is for a break in the storms.


Tuesday, December 21, 2010

MY OLD FRIEND AND NEMESIS


Here is a weekly chart of GOLD, a market that I have made alot of money trading this year, yet been wrong about the big picture here. I guess I would rather have the money than the ego boost from being right if I had to choose, but it would be nice to have both. I have no desire to see the public get fleeced even though it might seem that way. I am just pointing out in here that rarely in history if ever, has the general public been right indefinitely about huge market moves. They have been here for a few years now which I think probably throws this into a dubious category. I guess the Internet bubble might be another occasion as well as real estate, where this has happened. I do think all of these are the same.

I was listening to CNBC and that Fast Money or whatever that show is called yesterday. The one trader was stating that there is now heavy institutional selling in this market where there has not been before. I would beg to differ on that. If you look at the COT report, this has been going on for quite some time and it is evidence of why you have to be very careful when these big trends get going with the COT report. Often the Commercials will be heavily against the trend for months at a time, so you can not use that as your sole basis for bias. The other thought that has crossed my mind is that the way the government is playing with all of the numbers who is to say they are not also doing so in the COT report?

For the first time in quite awhile we now have some very significant divergence coming into this market in the momentum indicators. You can see the 3 lower peaks now in momentum against 3 higher peaks in price. This is a sell signal. How to enter the trade is up to an individuals own approaches, this is just a bigger picture occurrence that should lead to some downside action. Will it be a huge peak or just a pullback? There is no way to ever know that in advance. I suspect a pullback only. These prices are being rigged by governments so there is a huge amount of buying power to buy dips to keep this bubble inflated.

One of the things I keep hearing that is so frustrating is that during times of trouble GOLD has always been a great place to put your money. Let's take a look at that and see if it is a theory that should work, or one that is actually born out by history. The first chart here shows the last 2 market crashes and what GOLD did during those periods.


How can this be? In the aftermath of the Internet bubble GOLD was flat. You can see then it rose with the price of stocks afterward. Next we have the great crash of 2008, GOLD went down, then again recovered in price when stocks did. So far 2 for 2 of it not doing what the pundits say. Let's go further back in time, maybe I am just not getting this.


The famous crash of 1987, the single largest percentage drop in one day in history, surely GOLD must have been a flight to safety spot then. Oops, apparently not, it declined. Going back to 1982 which was a nasty time in our country with high inflation and soaring interest rates. There are some who debate that was worse than our current situation. How can this be GOLD plummeted during that period. Is this a typo? The data must be wrong. The running tally now, 0 for 4.


Here we have the nasty decline in 74 and 75. Well we finally found an acorn didn't we. Gold actually rose during this period, we broke the shutout. We have now found 1 out of 5 crisis periods where this theory actually bears out. Even in this case you can see GOLD was already in an uptrend following stocks up to the top, it simply just went up a little more during the decline. This is hardly proof of this theory at all.

The point of this whole exercise is not to prove GOLD can't keep rising, it surely can and may. However, if you choose to invest in this, do not do it based on the theories that are out there about it being a safe vehicle in times of trouble. Even though the theory makes sense, throughout history this has not proven itself out in actual price movement. If anything the tendency is for it to go down not rise. This recent run for the most part tracks the stock market as a whole, if you can't see that by looking at charts you are just blind. I believe this is true because really bad economic times generally result in big deflation. During a deflationary time commodities will generally decline. Maybe this time will be different but any reader of this blog knows my thinking on that probability.

As a long term player in this market there is certainly no reason to change your plan at this point. As a short term trader there are alot of reasons to begin looking at the short side here.


Monday, December 20, 2010

IT IS COMING THIS TIME


Here is a chart of the VIX and alot of other stuff on it. I won't apologize for this mess, anyone who is a trader is used to looking at things like this. The Green Line is the SP 500 and I have marked off with arrows where moves in the VIX beyond containment bands have triggered reversals in the SP 500. By and large this is a very good way to time the SP 500. It has bad signals just like anything else, and there have been a couple since the FED took over the stock market a few months ago. Deal with it. If you had an approach that never generated a loss you would not be reading this blog, and also you would not be living on this planet either.

The bands can be anything from standard deviation bands to bollinger bands, you name it. You can draw regression channels, just go hog wild on this. The bottom line is that when the Vix gets stretched as it is now, reversals take place. When it gets extremely stretched ( not quite yet ), big reversals take place. What I am hoping for is the PPT to continue to play their games through year end, keeping this strong. That should result in a bigger stretch away from a central point. Who knows that may not happen. This is so set for a decline, that maybe all their games will accomplish is keeping the market sideways. Either way we have to be looking for sell signals now.

I gave in and listened to one of the gloom and doom videos over the weekend, this one from a dude named Stansberry. I don't know him from Adam, I have no idea if he has ever hit a ball out of the infield in all honesty. I will say his presentation was very well put together and difficult to challenge on a point by point basis. The bottom line is that when excessive levels of debt are reached, companies fail. The corporation called the USA is in this position. It is difficult to accept the conclusions these gloom and doomers make, but hard to challenge the individual points that lead them to these conclusions. I think the collective psyche of Americans will change quickly if the stock market happens to hit a rough patch. The "recovery" is nothing other than a cute BS story painted by the media to support their savior Barry.

This situation is years in the making and it is Greenspan's fault, not the current president or Bush for that matter. Greenspan started this bubble rotation cycle that led us here. He is the one to blame. What anyone should do about any of this is of course an individual decision. If you buy into the Armageddon type of scenario then do something about it. I personally have done a few things like gather up several weeks of extra food that is not perishable, and also made some water arrangements. Other than that it is business as usual. I do believe we have a reckoning period coming sooner than later, and I really have no idea how bad it will really be. It is hard to envision wide spread rioting in the streets, but people are people, and we certainly have our share of entitlement folks in this country. I see no reason why these people won't react the same way their European counterparts are. I heard some gal on FOX the other night ( of course a teacher the biggest cooks we have in this country ) claiming the government owed us all a guaranteed job and health care. She could not have been more steadfast in that belief. I wish I could buy her college and fire her.

One thought I will leave this topic on is this. I do have other business interests, and I see the following theme starting to shine through. Their is a voice that is optimistic, yet on the other had budgets are being slashed. Obviously the later reflects the true view on business prospects. I will just leave it at that.

The media won't call out Greenspan since he is a democrat, so don't hold your breath on that one. When he refused to ever allow any short term pain, and orchestrated rotating over inflated asset class prices, he eliminated the natural reversion to the mean price movements that keep things in balance. As a result we wound up with several things all at extremes and basically nowhere to go. Now they are repeating this with stocks and GOLD. I am sure they would love to think they can rotate out of them into real estate, but that seems to be a unlikely save that can be made. Real Estate is not going to be able to be re-inflated without a better overall economy. They have setup two places for people to go and of course that is why GOLD and stocks have the 90% correlation they have. They are both being artificially inflated by the same people. It is also why they are both going to decline together.

Maybe when this starts GOLD will separate and make the GOLD bugs a ton of money, we will have to wait and see. They have been dead right about the direction, but dead wrong about the reasoning since the dollar has not really declined, it has gone sideways. However, for the moment, these two markets remain joined at the hip. In general, both Gold and the dollar tend to have seasonal moves at the beginning of the year, the Dollar up, Gold down. This also lines up with the short stocks scenario.

I would suggest studying the VIX, there are a million ways to use it and I think you will be able to find many ways that will help you in trading the stock market swings with it. I have thrown out a few in here over the last year, there are many others.


Friday, December 17, 2010

BONDS SHOWING SOME LIFE?


Here is a market I have been talking about and been wrong about also. I have been looking for a buy in this market at it has continued to crater. We still have this big time divergence in the POIV indicator here, which at some point is going to provide a base for this market. It could be now. The bottom indicator is a new project I have been working on that I won't reveal other than just to display it. There is an expanding pattern in it which should indicate a low is here. I never know if the low is just for a short term move or a larger one with this indicator, but it has been a pretty good predictor of short term highs and lows. Today as I type this we are up nicely in this market, so we may be forming a low here. Ideally we will drift here for a week or two, then breakout upwards. That will be where I will be looking to get long, if that happens.

There is not as of this week much in the way of commercial buying coming into this market at all, and we have changed on the weekly from up to down. As a result, I think this low will be just a bounce and the next large move is going to be another leg down. As per what I usually say, there is no way of knowing if this will play out or not. It is just what appears to be developing here. It does tie into the equities January dip I am looking for. Since these markets trade inversely for the most part, if equities are going to dip, this market should rally.

The next chart is one I have shown many times before, but wanted to show it once again. Look at the incredible link between GOLD and Stock prices. I continue to be amazed at this, but I watch it intraday at times and am amazed how every little move in the ES prompts a move in GOLD. This is just so bizarre but it is what it is. You can see this pretty much started in 2008, prior to that this relationship did not exist.


Since it does not appear a big equity crash is anywhere near, it is likely Gold continues to be strong based on this relationship. The Dollar is in an interesting spot right now. On a weekly basis we are still in a downtrend, yet the daily has had a nice little bounce, leaving these two time frames somewhat out of sync with one another.


Now that today has taken out this area indicated on the chart, it make this picture a bit unclear to me, hence no trades to make. The Aussie dollar does appear to be setup for a buy on Monday as do a couple of other currencies, so maybe this is still a sell here, but it is not clear at all at this point.


I have noticed recently my readership here has been increasing, so I wanted to say thanks to those of you that read my blog everyday.

There was a question about what a reversal bar is. That is simply a bar that trades down below the prior days low and closes up for the day or vice versa.

Wednesday, December 15, 2010

SOMETHING I JUST NOTICED


This is a chart of the SP 500 weekly with the 30 Yr Bond Overlayed on top of it in Purple. One relationship that is forever joined at the hip is that of interest rates and stock prices. Money flows to where the greatest returns can be found, and you can see this graphically above. If you look at the stock meltdown of 2007 and 2008 you can see that as we neared the bottom, there was a monster rally in the 30 Yr Bond. Of course this was initially a flight to quality in the safety that Government Bonds provide. However, what ultimately happens in these instances, is that the yield on those bonds gets driven down so low when this happens, that the return on the money becomes unattractive. As a result, what typically happens is it then works it's way back into equities creating big rallies.

The opposite is equally true, when stock rallies carry on for a long time, money leaves the safe haven of bonds and pours into equities. During these times such as now, there is very little fear at all, and the price of bonds drops ( yields rise ). There again comes an uncle point where money will flow back into the higher yield area, once rates move up enough to move the relationship again back out of balance. We saw a minor case of that in the middle of the chart where I have marked Minor, and it caused a decline in stock prices. If you look at what we have now on the far right side of the screen, we have a much larger divergence beginning to develop. The price of bonds has been declining sharply in recent weeks, and this is going to spell trouble for the PPT at some point. They of course are trying to make all these things move together, which is just not possible over long time periods, and something is going to give here.

Timing the exact turn with this type of a fundamental is impossible, but it always factors into what I see as my overall view on things. These are some of the reasons why I have been saying recently, to tighten your stops on things even though it is not time to go short stocks. There are bond models that use this type of logic you can find on the web. Yardeni has a good one although I am not sure if you can find it free anymore. It compares yields of various asset classes and there uncle points in terms of inter market relationships and money flows.

If we combine this with the 18 week cycle I wrote about yesterday which is this week, we now have a couple things falling into line here. We also have the January seasonal tendency out there, so now what we have to do is start looking at price action to see if anything is brewing there.


We don't really have anything here at this point. We see price moving steadily higher, thanks Ben! What would need to happen in my world in the next couple of weeks is for my momentum indicator to move underneath it's trend line first. Next we would need to have some type of break in price to accompany that. If we were to move sideways in price over the next couple of weeks this could develop. We have to pieces in place now for something, but the price has to confirm it. Trading off fundamentals alone can leave you on the wrong side of the market for long periods of time and that is no place to be.

Watch the Bond Market carefully here. If you are a bear, hope for it to continue to roll over. That will be the end of the stock rally if it does. We are really on the border line now of what is not quite such a huge divergence between stocks and bonds to make it a no brainer. It is just getting close to that uncle point. I will cover this more in upcoming posts.

Tuesday, December 14, 2010

LET'S LOOK AT JANUARY


You will have to enlarge this chart to get a closer look at what I have displayed here. As far as I can tell there has been a pretty consistent 18 week cycle top to top in the stock market going back for quite a few years now. It does not get every top of course, but by and large it has gotten most of them, or at the very least price has declined when these dates have arrived. Ironically, this week indicates one. I did this from years back going forward, so I did not curve fit this to today's date. I was in all honesty surprised to see one right here. Now that I have displayed this and talked about how accurate it has been, I will say that I doubt this one will be spot on. There is so much going on with year end, and everything else I have outlined in here, that a decline before January would truly be a shocker.

Nobody should ever trade just off something like this alone anyway, but it is just a tool to keep us focused on possible windows of time for action. Although seasonals tend to have their periods where they stray quite a bit, there have been down moves in January enough in recent years that we have to at least pay attention during that month. There has been alot of artificial inflation in the indexes this year, so maybe come January we get a little bit of a break to see if the fawn can stand on it's own legs. Of course if he starts to tip over, then the PPT comes back in to support him. Sounds reasonable doesn't it?

We have gotten really extended in price, but that often happens in strong trends, so that is not a reason to get too excited about selling. I learned early in my career and in a painful way, not to stand in front of things like what we have going on here. It is a lesson I still learn from time to time.

Here is a chart showing that 5 out of the last 6 years have had declines in January.


Ironically the one year that did not have a decline in January, was the year of the major top. As I mentioned the other day there are Gann people talking about Jan 11 as a top date. Of course we don't know if they have had 25 other dates that have come and gone the last 6 months that have been wrong, a high probability. In any event, it might be worth your own individual studies to determine if there is a window for action coming. It does seem to me there is enough to at least take a closer look at things. This whole thing is going to come to an end suddenly when it does, and there will not be a banner being pulled behind a plane alerting you to it.

The next chart is an individual stock that has about as much divergence in my indicator as I ever see. It also lines up interestingly with the Oil complex, which seems to be setting up for a sell signal. This might be a good way in the equities market to play a oil decline other than etf's if one occurs.


We are still making higher highs here but situations like this often turn on a dime.


Monday, December 13, 2010

PLAY IT AGAIN SAM


Here is the weekly chart of the Dollar Index. It is clearly in a down trend with a bounce happening against the downtrend right now. This is in a sell zone right here and I am currently short this market. I have a possible future track of this market mapped out with red arrows. The reason I have that as a possible scenario is that the momentum indicators have turned upward. In a situation like this I take the sell then if the buy develops, reverse the trade position. You can see we are coming up to the typical period of seasonal strength, right around the first of the year. This has been a pretty reliable seasonal pattern if you look back and check it out.

For the moment though, it appears we have another wave up going in commodities and down in the dollar. There is no way to know if this will just roll over and tank or drift down, then reverse. Maybe it won't do either? There has been a recent tendency for a decline in January in stocks and I was told by a friend there are some Gann cycle people predicting a Jan 11 top. If that were to occur, that would tie in with this above scenario nicely, since these two markets trade in opposite directions nowadays. Gann analysis to me is completely worthless, but maybe a blind sow will find an acorn on Jan 11th? If you draw enough lines on a chart something will happen at one of them, yet nothing happens at most of them which is the problem with that type of analysis. How in the world do you know which of the 500 lines you have drawn means something?

As we roll into the new year, I doubt anything with the PPT will change dramatically. I suppose they could take a breather in January now that they have carried the world on their back for a whole year, but why stop now? The mission is to artificially inflate things until they can carry themselves on their own. I have no idea if this plan will work or not, but I am sure that the market would not hold these levels if they backed off with what they are doing. I doubt they will. Until we get some type of sharp break, then a rally that fails and price takes out the first break point, it is business as usual on the up side.

The next chart is something interesting to me to show with the BOND MARKET.


This is something Larry Williams pointed out to his students recently. I will not disclose completely what it is, fellow students who read here certainly recognize this. It is basically a measure of a fundamental in the market, and you can see that in the past when we have dipped into this zone, we have generally had nice rallies. Just like anything else there are a few exceptions, but for the most part this has held true. Many are calling for a major top in BONDS and maybe we have seen it already. However, we should get some type of bounce here and we have not so far. February has generally been a good place to short bonds, so maybe this will generate a rally into February that will provide us with an ideal short entry in this market.

Of course it is also possible that we will just roll over here. The one problem with that scenario, is that is going to mess up the PPT completely. If interest rates skyrocket, the "recovery" will be de-railed and the whole point of what they are doing is to create the illusion that there is a recovery. This is must see TV going forward here. Something has to give in all of this. We know that Bonds traded inversely to stocks and so does the US Dollar. Who will be right? The PPT is trying to get BONDS and stocks to trade together, and I don't think they can pull that off.


Friday, December 10, 2010

I GUESS I MISSED THIS ONE


As I look at the chart of the SP 500 above, then listen to this chatter about how if the current tax rates are not extended we will have a double dip recession, it makes me laugh. This is absurd on a number of fronts. First, the single dip is not over yet. It is only the FED's manipulation of the stock market to these bubble levels that provide any evidence of a recovery. We all know this is bogus, although the numbers are what they are, you can sell stocks for a much higher price than you could have previously. However, there is so much BS surrounding virtually every subject now it is almost impossible to figure out the truth. Since my wife constantly has FOX news on I often find myself on the 2nd floor in my entertainment room watching ESPN. I just cannot take all of this crap anymore. Fortunately I have a bigger plasma up there for just this reason, so I get the bigger TV screen for my isolation! Although I am a conservative, both sides are equally full of it and I just can't take it any more.

There was an important memo I apparently missed regarding the tax structure in this country. I must have missed the enactment of the law that made it illegal to contribute more to the government in tax payments than what the tax code requires. This apparently makes is impossible for so many people that think the "rich" should pay more, from contributing more themselves. Obviously since it is such a great idea to pay more, those proponents of progressive tax rates would clearly also pay more than there share if it were not prohibited by law. Oh, wait hang on a minute, they don't want to pay more they just want someone else to. They are being generous with someone else's money! I would back a law that eliminates all tax shelters from the Hollywood elite, one fat film maker in particular. This way since they want everyone to pay more they won't mind also doing so.

The way the law would work is that you have all the tax shelters available that everyone else has to begin with. If you speak out publicly indicating a preference for progressive tax rates, your rights to these shelters go away, hence you will pay more taxes. After all you want to pay more as a big wage earner so you will get what you wish for. You will get what you want everyone else to do. Seems fair to me. This would certainly solve some problems wouldn't it? The government spends too much, it is not a matter of gate receipts. One more comment about how we need to spend more on education and I am going to kick someone. We spend trillions that is not enough? Maybe we should give every teacher a million dollar annual signing bonus, would that make people happy?

As far as the market goes, the FED is in complete control of this market, so any news on this front either way will have no effect on stock prices. If a dip were to begin they would just through their channels launch a massive futures buy program that would bring it right back up. I am obviously in favor of extending the current rates, but I doubt either way it is going to effect the economy if they are not extended. However, I do have a close friend who told me over dinner a couple of months ago that he was holding off on expanding his business, opening other offices and hiring more people, until the tax rate issue got resolved. I suppose he serves as a real life example of what some claim is happening right now. I personally will cut back on charity if they do it to make myself whole, of course. To think that no changes in consumption at all will happen is just disingenuous BS. Maybe the billionaires won't change, but I have had million dollar years and you would be surprised how little that gets you ahead by the time you pay taxes and everything else that goes along with it. Most people making that amount of money are not living in $800 per month apartments, so they have overhead that eats quickly into the net of about half of the gross pay. Wouldn't it be great if the government resulted in me rescuing fewer animals in need because they want to penalize me for making money?

This rally is not going to get stopped by this legislative battle either way so don't buy into that crap. We have year end bonuses now on Wall Street which will be huge so these insiders have every intention of not letting any of those go here in the last 2 weeks.

It looks to me like the grains are setup to make another push higher.


Here is a chart of Soybeans and you can see where my order is resting to go long in this market today if we trade up that high. It appears to me that Corn and Soybean Meal are the laggards here, so longs should be done in the other 3 if they are done at all.

I don't see much else today, I expect the markets to be quiet. I was also trying to go long Sugar today, but it appears that order is not going to be filled.

Thursday, December 09, 2010

FIND YOUR COMFORT ZONE


All traders have different styles and different comfort zones within those styles. There are some who are momentum players and only feel comfortable buying on 20 day highs and selling on 20 days lows. I am not one of those people. Obviously we have a tremendous up trend in the market, and in most markets for that matter. It is clear the correct side to be on is the long side. However, for me, initiating new longs at a stage like this in a trend is not where I find my best trades. There is a big difference from having been long 2 weeks or 2 months ago and feeling fat and happy, and being long from today. As we see these markets continuing to extend, this is just not a safe zone to be a buyer. This does not mean I think a huge decline is coming, I seriously doubt that.

Most of my strategies are based on trading patterns that repeat with high levels of reliability. It is rare that any of those patterns form up during blow off phases of trends like we are in now. I generally trade 2 ways. I look for pullbacks in momentum that turn back in the direction of the trend, and secondly, I trade reversal patterns where there are very prominent divergences against the trend in the indicators I use. When we get into an area like this, neither of those are present for the most part. I have a couple of charts that follow where I think there may be something developing.


This is the Dollar Index daily chart. I have noted the recent rally is in the larger context of a weekly chart, a retracement in a downtrend. It is for that reason that I am looking to get short here as prices come back into line with the larger time frame trend. Yesterday was a tiny little "doji" bar for you candlestick fans. I do not like selling below lows of these bars in spite of what the textbooks say. I have not had good luck with those types of entries, so I am waiting for something a bit more clear. However, we are in a spot where I think it bears watching for a short entry any day now in this market. Of course the opposite of this is to look for longs in individual currencies, that is a personal choice. Those trades would be highly correlated with a short in the Dollar, so keep overall risk in mind when deciding what to do here.


This is Unleaded Gasoline, by far the strongest commodity in the energy complex. This is pulling back in a very strong trend, also has that little crappy Doji bar yesterday. If you are bullish in energies, this is the one to get long in, it is leading the way. There is one thing that really bothers me about a couple of longs here and it is barking loudly in a couple of places, Crude and the NAZ.


This huge divergence in the Larry Williams POIV indicator you see above is normally an automatic pass on the trade for me. This is also present in the NAZ and bullishly in the 30 Year Bonds. All of these are saying the same thing, be careful. Since Crude trades lock and stock with the Stock Market right now and Bonds lock and step inversely, we have confirming divergences telling us to be careful of new longs up here. Then we throw in the NAZ which also has the same thing, and we see that these are warning signals.

I find myself very uncomfortable with all of this when I reconcile it with the actual price action on the charts. I really want everything to be consistent, and that is why I am having a hard time finding good trades right at the moment. Trading against things like this divergence in strong trends can and does work at times. However, it seems to me that when I do it, the trades lose, so I don't. Maybe what will happen is we will just meander here and this will catch up, but it is going to take alot for that to happen.

In the meantime, I scalped a little money out of the long side of the Aussie overnight, and am just sitting flat again now waiting for some resolution to this.


Wednesday, December 08, 2010

THINKING OUT LOUD


This is an intraday tick chart of the emini SP 500 just for the last 3 days. You can see that every time we go down at all, mysteriously price always bounces back up immediately. Obviously in a true free market you would have some random action, we have none nowadays. Price moves are perfectly delivered to us in a nice neat little package. In a free market some declines would continue and some would not, especially on intraday charts. Just the fact that even intraday declines almost never happen for more than an hour is summary proof of what is happening. This leads me to the following question I keep asking myself, "Why did they allow 2008 to happen?"

It they have the ability to do what they are doing now, why didn't they do it before when it was more necessary? Of course there are a number of possible answers to this question. The big time conspiracy theorists like the Sham emails going around from some guy called "the falcon" would say they orchestrated the downturn intentionally. There are others, all though very small in number nowadays, who would say the Fed has no ability to control prices and people like me are full of .....

I think the reality is that the truth is somewhere in between these two extremes. The whole point of the PPT is to stop plunges from happening. That is the reason it was formed to begin with. It would make no sense for them to deliberately escalate that to which they exist to stop. On the other hand I can't find a market commentator who has any credibility, that has not admitted the Fed is creating this whole bull market. So where does that leave us? It leaves us with new market rules with one big asterisk. That asterisk is volume. Since we can see from the above chart, 2 of those 3 saves were in the overnight sessions when volume was light. It is easy to give money to banks and other institutions with a wink that putting it into stocks and futures would be a good idea ( what the Fed is doing ). It is also much easier to move the markets during the night sessions when volume is generally pretty light.

Last night was a great example of all of this. I was watching GOLD get hit pretty hard, some of the currencies were starting to get driven down, the ES went down 4 points pretty fast. Crude Oil was down over $1.00, it was looking like a small rollover was taking place potentially. Of course when I woke up this morning everything had been reversed back up once again. It is imperative that they do this on light volume. The horse got out of the barn during the 2008 crash, and once volume became that heavy, they could not do what they are doing now. For every 100 lot they did someone else was doing a 200 lot in the opposite direction. They chased it all the way down. If you look at the COT data it clearly showed what they tried to do but were just too late.


This is a chart I have shown before. You can see that "some" unknown player was buying huge amounts of futures contracts as this decline accelerated. The distance between those 2 arrows represents $32,000 per emini contract, or $160,000 per full sized pit contract! Does anyone out there know of any fund, or individual trader who would be able to withstand a loss that big? Of course we do not know where in the COT data the PPT's activities would be categorized, but by law it should be the Large Speculator category. The FED is not a government entity or a hedger. Large traders by nature buy on strength and sell on weakness. They are scale in and scale out players. I cannot find one other single instance of the Large Spec category ramping up that heavily on a huge decline in any market.

In this case they were eventually able to get this under control but they lost countless hundreds of millions or more doing so. It is my contention that they are aware of the possibility of another downturn and as a result are keeping as tight a rein as possible on things so that this type of scenario does not play out again. Once volume shows up and it gets going, the FED cannot throw enough money at it to stop it. This is kind of like a 4th down and a few inches. The other team crowds the line with everything they have. Generally those plays make or lose inches. However, occasionally someone breaks through and it is a breakaway play. This is what they are trying desperately to prevent. So far mission accomplished.

With all this in mind, if you are shorting during the night sessions, keep a very tight leash on the trades, and take profits quickly. Those moves in those sessions are going to continue. You should not be trading in and out during those time periods anyway, but some people can't help themselves. The new rules we are left with are basically we have a heavily one sided market, so at the very least if you take sell signals, you should reduce your size on them. There will come a time when the market will shift to a downtrend and that will be the time to be aggressive on shorts. If you choose to short stocks at least pick ones that are in weekly downtrends and not following the market as a whole. That should enhance your chances of success in those trades.

I have noticed a big sell off in Gold happening right at the moment. Readers know I think this is the bubble of all bubbles. Whether or not this is the beginning of something or not is impossible to tell. However, as I have stated over and over in here, when this breaks it will do so out of the blue and the exits will be more crowded than anyone could ever imagine. I do not have sell signals in the metals here, so I am not short at this point. I still think we will see $100 down days in gold when this starts and that is when we will know someone finally yelled "the emperor has no clothes." This move is the sham of all shams and I still maintain that view even though I have already been off by about 10 months ( an eternity ) about when I thought this would come crashing down. It is my contention that this and Equities are deliberately created bubbles by the FED to give people places to go to make good returns. We have seen them rotate bubbles over and over with Greenspan being the original orchestrator of such moves. However, my timing has not been correct here and I have had egg on my face due to it. However, I will be vindicated, I would literally bet my life on it.

Tuesday, December 07, 2010

Not Alot To Do


This is the SUGAR market and it shows the only trade I have going right now. I went long this market a few days ago where indicated. Today it is also having a nice up day along with everything else across the board so far. During these major bull markets there are often times when there is just nothing to do if you are a short term trader. When we get on runs like we are now where just every single day keeps creeping higher, you have to be very careful of counter trend signals. Many oscillators will diverge when these types of things happen. Trust me, you don't want to act on these divergences unless they are really prominent. I can talk all I want about what is driving this, and I have. It does not really matter, the charts show it all. This is a bull market PERIOD.

This bull market does have nefarious roots without question, but the tape tells it all. With the strong year end seasonal tendency, combined with the FED interventions, it appears likely we will soar into the year end. I think everyone has pretty much realized that all of this is an insiders game and the wall street boys are not going to let the bonuses slip away at the end of the year. If we happen to get any pullbacks, they are buying opportunities.

One of the negatives of being a short term trader is that we trade both sides of markets. When we have these major trend moves that just go one way perpetually, it becomes hard to find trades. We don't get big enough pullbacks for entries, and we can get run over trying to fade the trend. You have to learn to push away from the keyboard and be patient. I always try and keep the thought that all I really need each month is 3 or 4 really good trades, and I make the money I need to make. They can happen at any time, so I try not to force the action. At times in the recent past I have forced the action just to dig myself deep holes to climb out of and that just wears you down over time.

We do have the VIX making another new low here today which has wiped out the divergence in my momentum indicator there. That does make sense since I had said I had never seen a formation of 5 higher lows in it, and now we still don't have that. This is still a short term sell signal, but it has to have actionable price action to go with it to consider shorts, and there is not any of that.


This expanding price action to me in the VIX is interesting, it would not normally support a blow off move like what is occurring here. Of course, alot of things that were formally normal, are not now. I know as long as I trade I will never forget this bull market, it has changed many of the rules forever it appears. I would suggest being very careful about using any trading techniques you have used in the past. Most of the traditional approaches to trading have become worthless in this environment. If you change your approach to just buying anything you look at every time it just makes an hourly low only, you will make money in this market. If you did only that during the prior 200 years, you would be wiped out quickly.

The current move is also getting extended once again, normally reason for pause, but not in this market. It might make sense to look at short setups as traps, and research the times in the past when your sell signals have failed. If you find a sell signal being triggered now and some of the elements from failed signals in the past are there, you might want to use it as a buy signal. We always have to adapt, and that is an example of doing so. You always have to be monitoring how to best trade in each environment that presents itself.

I am still watching the Bond Market closely here for a buy signal due to the massive divergence I showed in the last post. There is still nothing there yet. It will probably be a few days at the soonest before something could develop there. I have drawn in where today's price is, and you can see it has made another new low. I suppose this could be a trap and reverse, but today's range is pretty big so far, so trading above it's high tomorrow is not too likely without an equity crash to trigger that. I think it is likely that I am going to have to wait for a bit longer here for a trade.