INCONSISTENCIES

As we sail along waving to the crowd celebrating our huge recovery and looking forward to a "boom year in 2011," I find it troubling what I am about to discuss. When I do my weekly analysis, I am finding alot of markets setup very bearishly. The only bullish setup I see is the Yen which is a contra to the US stock market generally speaking, having been a flight to quality spot recently. This should not be the case with this perfect storm the fed has concocted. We should be seeing a major inflation wave ( what they are trying to create ). There is one occurring right at the moment, but it is beginning to look like this will end the way all other artificial moves have happened in history. Prices historically have reverted back to the mean, an almost statistical certainty once you get extended as far as we are now. See housing of 2005 for a prior example. It is of course our challenge as to how to time these reversions.
With all the analysts calling for these huge equity moves next year, some even for new all time highs in stock prices, we should be seeing a plethora of explosive buy setups. I did not find one single one of those in all the markets I looked at. The above chart is COPPER and you can see how closely this has resembled the stock market. This is an industrial metal that does track stock prices closely. Look at the huge Small Speculator longs in this market ( marked by my red arrow ). This is also accompanied by a big increase in commercial selling, taking the short position to the highest level we have seen it since 2005. It is often somewhat normal when a big rally begins for the commercials to get immediately heavily short due to their hedging activities. Once we get longer in the tooth in a rally, it is a little different. From a hedging standpoint you could certainly argue that this also makes sense since they are protecting a huge windfall.
However, you could also argue that keeping a lid on prices is also in their best interest, which is another way of explaining commercials heavily shorting once a run gets going. Here is the closest prior example I can find where commercial activity was similar to what we have here in the above chart, with the small specs also heavily long. It actually happened at the end of last year, hmmmm....

It is certainly interesting to me that this happened at the same time in the year, but that may not be significant. You can see the last time we had this setup, we got two sharp declines. This market will not decline unless the stock market does. We have a showdown setting up. We have the Fed putting money into the stock market on a daily basis through POMO to make sure stock prices keep rising. I have stated repeatedly, that they have been able to drive this due to the volume being light. We have a very big volume source in the opposite camp of them now. This is a showdown coming, fundamental forces vs government intervention forces. Who will win? So far the FED is rolling every competitor that challenges it like an Old Nebraska football team. Just running the ball up the middle on every play for one first down after another. However as we all know, Nebraksa's offensive strategy ultimately ran into trouble when everyone figured out what they were doing, sound familiar?
What I have stated repeatedly, and you can find your own historical examples of this, is that when markets get extended this far, the reactions will be equally large. I also see in my perusal of the markets, that both Gold and Silver are now setup again fundamentally for declines. Since we know these track stock prices very closely nowadays, this is also a bearish development. We are now seeing some pretty prominent divergences in weekly charts, that have not been there at all during these huge rallies until now.

That is a good amount of divergence now in the momentum indicator. You do not just go out and short a market due to something like this, but it is an early warning to be on your toes. The next chart is GOLD and you will see an even bigger divergence here.
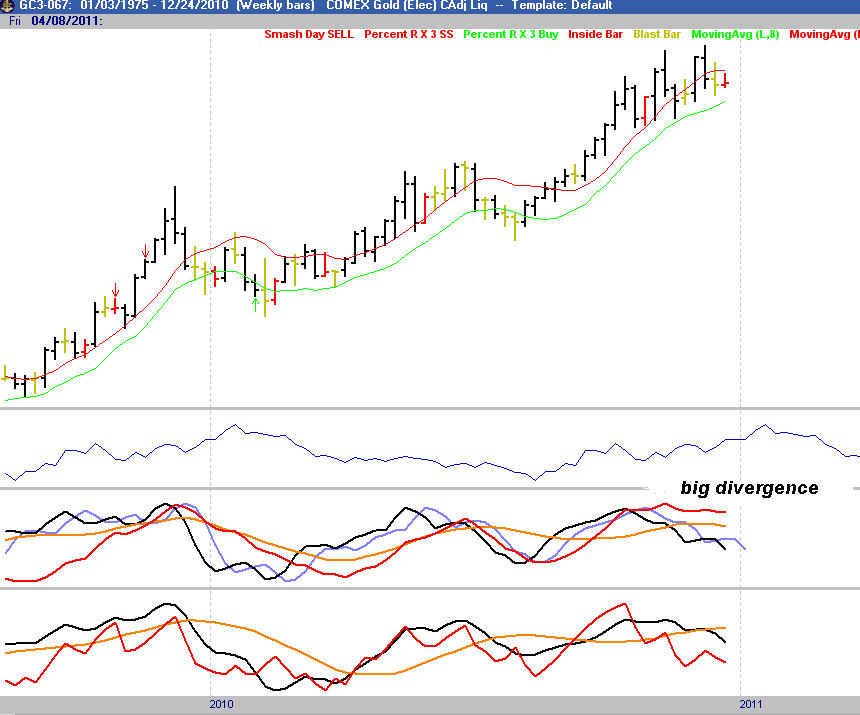
This has been the weakest of the three metals, and it is no surprise that it has the largest divergence. This is the one to short if you choose to short the metals.
I also think the Canadian Dollar is setup very bearishly, in a similar fashion to Copper above with the difference being it has not rallied anywhere near as much. The Swiss Franc has a very bearish setup as well.

This is a triple divergence potentially, a very powerful sell signal that seems to be forming. I could go on and on, there are many markets setup for sells. Crude and Unleaded Gas have been commercial selling going on. It appears in summary, that we are about to get an across the board decline. I doubt it starts before year end, but in case it does this week be ready to go.
We should see some sell signals trigger in the next couple of weeks, it is yet to be determined if they are just minor or major in their magnitude or duration.
2 comments:
Hey, I am checking this blog using the phone and this appears to be kind of odd. Thought you'd wish to know. This is a great write-up nevertheless, did not mess that up.
- David
What is it that is odd, you did not say? Is is displaying strangely? Are you using an Iphone or some other type of phone?
Post a Comment