DISCLAIMER

PLEASE READ THE DISCLAIMER AT THE BOTTOM OF THIS PAGE WHICH APPLIES TO ALL CONTENT IN THIS BLOG AS WELL AS ANY OTHER MATERIAL FROM WE ARE FUTURES TRADERS LLC. READING ANY CONTENT BELOW CONSTITUTES AN AGREEMENT BY ALL READERS THAT THEY HAVE READ AND AGREE TO ALL THAT IS SET FORTH IN THE DISCLAIMER AT THE BOTTOM OF THIS PAGE.


Friday, March 30, 2012

WHAT'S GOOD FOR THE GOOSE IS GOOD FOR THE GANDER


When I thought about how I have harped on Gold as being a big bubble, our crazy uncle Natural Gas is the opposite. This weekly chart above almost looks like Gold turned upside down. This market has just been pummeled for years now. Similar to Gold yet in inverse fashion, some very good traders have been trying to invest money into this beaten down area hoping to catch the bottom. Needless to say those trades and or investments have not worked out very well so far. If you look at the POIV indicator here in purple, look at the huge amount of distribution we have had. I cannot remember ever seeing anything this extreme with POIV.

We also have some interesting things going on with the COT report here that are worth mentioning. The normal patterns have a few different looks and I have labeled one of them here. In that instance you can see a big down trend that had a bounce. During that bounce the commercials sold pretty aggressively, giving us a nice sell signal and entry. This is the best possible signal you can get with COT data. Often they are just hedging, so they will be buying heavily during big down trends like this. You can certainly see several instances of this on this chart. I have marked off another situation which is unusual, and it occurred 3 times in this market.

This situation features what is called capitulation. In these instances, you can see at the end of moves down that got extreme, you actually saw commercials give in and get heavily short. When this happens it is basically them crying uncle. They have lost enough money on their hedging that they are not willing to lose any more. When we see this often a tradeable bounce or much more than that is not far away. You can see this is happening now, with the commercials doing quite a bit of selling in recent weeks. With the price dropping as sharply as it is, this makes me think we might be close to an important low here.

If you study charts and look for this type of thing you will also notice it was in place at the last major top in Oil prices, before they had their precipitous decline down into the 30's after going over $100. This type of situation is no where near a trade today type of thing. However, it bears watching to see if we happen to get a trend change while this type of thing is going on. If we do, this could wind up being very interesting on the long side. One thing that seems to get lost about commodities is that although they are known for trending better than stocks, they are also much more mean reverting than stocks are. Long term charts tend to look more like EKG's than slopes like this or Gold that gone on for this long.

Timing the turns from a trend this severe is impossible. You could have argued that this has been extremely oversold for years and been right. Oversold can get more oversold, overbought can get more overbought. This is essentially an inverse bubble, and there will be some big money made when this sucker does an about face. Maybe we are seeing the underpinnings of a fundamental condition that could lead to this trend changing.

Wednesday, March 28, 2012

POLITICS IS RUNNING EVERYTHING


Tonight while working out in my gym I caught an interview between Lew Dobbs and a money manager who he said had called the markets movements more accurately than anyone else he knew in recent times. The guys name escaped me, but he said the following when talking about Bernanke. There will be a conversation between he and Barry after he gets Barry re-elected by his manipulation of the stock market, and he will say it is time now for you to save me. The thinking was that he was going to have to raise interest rates, and he would be able to do so now that Barry got a second term by him keeping them low for him.

I have absolutely no idea whether or not some type of relationship that direct is actually going on but I doubt it. Plausible deniability of course is likely in play and those conversations are probably between other cabinet members and the FED. In any event, the world is simply one insiders game after another. I think most people realize what the FED is doing at this point. Then we shift to this debate in the Supreme Court about Obamacare. It appears the Justices will go along party lines. This is infuriating to me. What the hell do party affiliations have to do with the US Constitution? Kagan had a role in drafting this legislation in it's inception and she does not have a conflict of interest? That is like asking a criminal to turn himself in because he is the only one who is qualified to determine if he did something wrong. Seriously? The process by which judges recuse themselves is one of the most laughable things in the world. They could go to the comedy and magic club and bring the house down with the comedy of that whole process.

I think you get the picture. Now we come to month and quarterly end, and we have another inside baseball situation in the stock market. Once again today right on cue between 12 and 12:30 on a down day the mysterious rally at the end of the day took place. What a coincidence that was. Money managers are told that it is illegal to window dress at the end of quarters, yet we see this tremendous upside bias that continues to be in place at these times. All of this makes me think we need a much bigger shakeout than what we had in 07-08, to get rid of all the crooks. I don't think we have gotten even a small amount of them. The proceedings over MF Global have Corzine denying everything, another guy taking the 5th, and a trail they are trying to paint where nobody knows who did what. In the mean time many individual investors have been fleeced. 

I could go on and on, and I am sure in the businesses readers work in there are equivalent things going on. Everyone just has to rig everything so they take random chance of different outcomes out of the mix. However, there is a funny thing about life, the natural flow does have a way of getting back at all these man made attempts to rig things. This is why we have these massive crashes at times. If we weren't always artificially moving things around, these huge reversions would not happen. As I watch this equity move in spite of all the other things going on that are not good, I don't know of a time when this amount of separation between economics and stock prices has occurred. It will be resolved by another huge decline, but the when and where is unknown.

I think the outcries about Gas prices are ironic. They conspire to raise asset prices by flooding the economy with liquidity. They even state they are trying to inflate asset prices, I guess they meant everything but Gas? Lets blame the speculators. Guess what, when money floods the market it is designed to increase speculation. Hello!!! I go back and forth between thinking these people are just plain stupid and them being smart and assuming the rest of us are the dumb ones.

In scrolling through some weekly stock charts ironically I found the energy stocks to be the laggards which does tie into me looking at the short side of the energy complex in the futures markets. I am still looking at the long side of Gold and Silver here but for Thursday they would have to really rally big to get me in. I will likely be looking at something for Friday there or even into next week.

The main reason I went through all this insider stuff in this post is to make people realize, that it's equivalent in the futures markets is the COT report. The insiders there are looking down in energies and up in Gold, so I am trying to get in on the conspiracy and not fight it.

Good Trading

Tuesday, March 27, 2012

IT IS STILL ALL ABOUT THE DOW


Here is a market that I am bearish on currently, Crude Oil. The real question is can anything actually decline in the midst of the monster bull market in stocks? There was a comment about correlations in a prior post. I try to ignore them in all honesty because it is really no way to trade. However, in this wacky world where the FED is just pile driving asset prices upward, it is hard at times not to consider what is going on.

On this chart you can see a great COT sell setup in Crude that is in place right here. Prices stopped right when the big boys starting selling. I think the most likely reason we have traded sideways here instead of breaking is the overall up trend in asset prices that is floating all the boats. I can tell you I had a ton of open equity the other day in a bunch of shorts that evaporated when the 10 point ES decline got reversed. This is a pattern that has played out in movie theatres all across the world since the 09 low. I do not know when or if it will end, but I am not worrying about it anymore. I have to take the trades that meet my rules, and if they don't work due to that so be it. There will come a time when the stock market does not rise every single day, and I don't want to miss a big one by arbitrarily throwing in some dumb rules about correlations.

I have stated this before, but to do it again, the way to use correlations is just to determine percentage of risk in your account, not to filter trades out. Most trades are the same as each other be it soybeans or currencies, so just trade fewer contracts when trading multiple positions. Crude looks good to me here on the short side so I am trying to find a way in here this week.

Sunday, March 25, 2012

GOLD BUGS DANCING IN THE STREET


As I have said all along, I am not biased on either direction for the world's most popular market. Now that the COT report has come out, we have a buy setup for GOLD. I stated in the prior discussions about the COT data, that there was some buying but it was not enough to really matter. Now we have had enough for it to matter, and you can see the red line, the commercials, have moved back into a heavy long position. Open Interest has also declined as have the Small Specs. All in all a bullish setup.

I exited my short positions in the metals last week, when some of my short term things showed a lot of divergence, and price just seemed to want to hold. I also exited my DZZ etf position on Friday morning early taking a small gain out of that one. Overall all three trades made money, but were not big wins. I took a decent chunk out on Silver because I got in that pretty good and had a lot of contracts.

I don't really have a daily buy signal at press time here, but I have yet to really look at this closely. The net of this is that we now have a fundamental reason to look long. This should be a lesson to folks like our resident bull in here Robert as to the use of the COT data. I just look at it for what it is without a market bias. I don't ignore buys because I think this market is a bubble. I am a trader, I trade the signals, and don't pass off data that does not meet my view. I am looking for buys in Gold this week. I could give a crap about all of this talk such as it is a store of value, it has never gone to zero, blah blah blah. That comes from people who don't trade who are making commissions selling you something. They are essentially realtors. I love the Gold Line adds where they give you free the monthly newsletter that is a "$25 value." Who in the world would pay $25 for something that just says the price will go up no matter what happens? Don't we already know what it says? Isn't it just four words on one page GOLD WILL GO UP? There I just saved you $300 a year, you will able to afford my web site now.

I want to revisit our artist formerly known as the mystery chart now known as the Euro COT position. The question is, has the refusal of the market to decline here indicated this predictor is no longer useful?


I think the answer to that is no. If you step back and take an overall look, what is this really saying? Ignore all the little minor wiggles, where are the major moves? To me the very short term top this had predicted is really a wiggle, the overall prediction is a significant continued rally after a pause. It really shows significant upside starting in June, more than it shows a big crash that should have started. This is how you have to look at things like this. It is a road map, it is not going to give you an exact day to scalp 5 poinst out of the ES on a tick chart. The fact of the matter is we have a huge bull market on our hands, and I see this as really supporting a much larger move coming.

Some folks I am sure would say the economy is no good so how can this keep going? My answer is the economy has nothing to do with the stock market. The Federal Reserve controls the stock market not the economy. This is also why the COT data does not work in stock indexes any more. The real commercials are the FED and their data is not in the report. They have pretty much told everyone to pound sand who has asked them to disclose what they are doing. They are never going to open their books folks, get over it.

The real research project would be to create in indicator that displays what the Fed is doing every day, and substitute that for the commercials position. I am not quite sure how to do that, but it would be worth the effort. Even though we did not get the little 3 month pullback this has called for, it still could happen, you can't babysit every single day on this. After all, this is the commercial position in the Eurodollar market projected 12 months into the future. How could we possibly expect that to pick exact dates for us. Even if it remains generally accurate it is a miracle to me.

For those kissing the Bond Market good bye I would hold that thought for a bit. The next chart shows a good buy setup for Bonds.


The commercials appear to be attempting to defend that last significant low on this chart buying into this decline. This is a buy setup like that of Gold, so I am looking for buys here.

Good Trading this week


Friday, March 23, 2012


I IS TIME TO DO SOMETHING ABOUT THIS


I was trading emails with a close friend and fellow trader yesterday during the last hour of trading, and once we hit 12:20 PST I sent the following email. "Here we are it is game time, perfect setup for the PPT to buy this." I am not sure if even 30 seconds passed before the ES moved up pretty sharply for a few bars. My next message was "In a democracy this should be illegal." 

There was a time I talked about his often in here, but over the last several months we just have not seen as much of this as we used to mostly because the market has just gone ever upward. There were no days that needed to be saved. I really could care less which way the markets move, I just want free markets. Like most people, I am not a big fan of interventions by governments. When someone like me can watch a screen and type an email like that almost to the second of when the futures have a mystery rally, you know someone is not right. I admit that I do not trade the ES or stock indexes that much anymore do to all of the shenanigans that go on.

There is also something else I need to make clear. Manipulations are not responsible for every late day save, or for that matter every rally on down days. There are natural ebbs and flows to markets, and when prices get extended reversions happen. This is statistics 101. Everyone except Gold bugs accept statistics. Statistics don't apply to Gold they will tell you because of ....... it can go up forever on it's own. With all of this aside, once you watch markets enough, you can tell when there is a buy program that makes no sense at all. It comes out of the blue when the premium is not out of line, nor are any of the other stats that signal when institutions initiate these.

If you look at the chart above, I have marked when around noon on days when the ES was net minus for the day, what happened in the last hour. You can see 5 of 6 days rallied nicely, one did not. I think we have all seen that in spite of all the complaining we are doing about our government and what they are doing to our country, they march on trying to take more and more control. At this point, if you can't beat em join em. We know they are going to either directly buy futures on these days at these times, or do it through intermediaries like GS and Morgan Stanley, so why don't we just tag along and pick up a few shillings for the trouble?

My project for the weekend is to study these late day saves that constantly happen and construct a mechanical method to trade them. My plan is just to check in at noon, see if whatever conditions I find to be the most consistent are in place, then take the trades. This is a different type of approach than watching a MACD or some other tool or group of them all day long trying to trade every wiggle. That is exhausting and not the way to make big money. You can grind out some money doing it but it is such a pain in the rear.

Most software programs will allow you to designate times intraday to program systems, so that is my starting point. One thing I like to do with trading as everyone knows, is back a daily trade with a fundamental condition. I feel this makes the trade better conceptually, and more likely to work and move more in the desired direction. This is difficult to do with intraday trading, fundamentals typically don't influence 5 minute charts. However, I would have to say now that the PPT is a fundamental. They have been operating in the markets for many years, and have become much more active on shorter time frames. The reason is irrelevant, although you can bet your sweet ... there would be hell to pay if they were launching sell programs and not buy programs.

At this point I am not sure where the research will lead whether it be to certain days of the week, days of the month? Possibly a different optimal time to buy than noonish? I suggest for those of you who like to day trade that this might be something worth checking into. We have an intra day fundamental, the government interventions on down days, lets quit fighting it, quit complaining about it, and take advantage of a government handout.

Have a good weekend

Thursday, March 22, 2012


IF THIS DESCRIBES YOU FIND SOMETHING ELSE TO DO


The following is a list of personality traits, read this list carefully and be honest with yourself about which ones fits you and which do not. There are no right or wrong answers, and there is no order to this.

1) Impatient
2) Impulsive
3) Volatile
4) Diligent
5) Competitive
6) Determined
7) Confident
8) Amiable
9) Calm 
10) Reactionary
11) Detail oriented
12) Introverted or Extroverted
13) Disciplined

The list could go on and on, but there are some points I want to make from a recent experience I have had. I will describe it first, then delve into these categories a little. This is not a chart laden post, but these types of things are so important.

As many of my readers know, Larry Williams is my main trading mentor. He recently launched a trading service that allowed individual traders to take some of the very same trades he was going to take. As you might expect, he sold out the allowable number of participants the very first day in a matter of hours. This service is pretty expensive. I personally did subscribe mostly so I could see the logic he was using to initiate the trades. I use many of his tools, yet it is hard for anyone to master the masters tools. There are always insights to be gained from studying the masters of any craft be it coaching, trading, gardening, running, etc.. Unfortunately what happens when you launch a trading service is, no matter how much you try to tell people what it is and is not, it still is difficult to get the correct blend of people you want. The get rich quick people are always lurking, and they misrepresent themselves. In fact about as sure a bet as there is in life if for someone to be dishonest with themselves about their own personality.

This is the main reason I have been dragging my feet about launching my service again. The dumb emails and complaints are difficult to deal with believe me. They will always come at a time when you have a bad trade or two going, where there is already pressure on. Now you have some person who has his last $3000 to his name relying on a trade you recommend. This adds additional pressure whether it should or not. Larry launches his service, and several friends of mine and blog readers jump on it and get in. They are aware that Larry has already more than doubled his own personal trading account this year. Expectations are high, too high. Larry warned people there is no easy money, this is not being coy this is just the truth. Even accomplished traders lose often. Some of the very best ones have winning percentages of 40%. Larry is one of the greatest to have ever lived, there is simply no doubt about that at all. He has proven himself countless times in public forums making millions of dollars in profits.

The first week starts, and of course, the week has a net loss. My one friend I talk about in here from time to time emails me. "What in the world is he doing, why did he do this trade, why didn't he short the grains? I am going to quit!" If you look at the grains, they have moved down some off the highs. However, I can tell you if that is the type of trade someone wants to make, selling the very strongest markets on the board when they are at multi-month highs, they need to find something else to do.

My response, "don't be such an amateur." I was really ticked off at him. Larry was hit with people cancelling the service, after one week and just a few losses! I wish I could meet every one of those people and back fist them. What a bunch of losers. He had a long waiting list, so it quickly filled up again. You have one of the greatest traders of all time who had a few losses, and probably has not had a losing year in the last 20 or more years, and you bail on him? That is actually the time to bet more heavily on him. This is why most people do not succeed in life, they have the herd mentality.

In the above categories, if you have been honest enough with yourself, what words did you determine described you the best? There have been countless studies done on what it takes to be a top performing trader. Of all the categories listed above, there is a somewhat random distribution of them in the personalities of top traders. However, there does seem to be a couple of consistent traits that do seem to be necessary. People that are able to remain calm during turbulent periods and not panic, tend to do the best. I can assure you there will be plenty of opportunities to panic no matter how good you are. If you are someone who is inclined to not handle crisis periods well, this is not for you. Everyone knows people that during times of stress completely change personalities. I call them crisis managers. If you are one of these go work on your golf game. You have a better chance at making the PGA tour than you do of trading profitably. It is hard to believe that people would panic at the slightest hiccup like what Larry had. These people including my friend have no business trying to trade. 

Many great entrepreneurs are impulsive people and it is one of the qualities that leads them to being able to create great companies on the spur of the moment. They go from one hot idea to another and act, one hits, and they are off to the races. In some ways trading can be done like that. You put some lines into the water, most get no bites, but one catches the big one. The problem with this is that you have to be patient, and most impulsive people are not. My friend is a perfect example of this. Many of the other traits can be part of your makeup and you are still fine. For example impatient can actually be a good quality because it will enable you to get out of bad trades quickly, a very important ability to have. You can also be volatile as long as that volatility drives you to work harder, and does not stay with you too long. If you can explode and release the feelings, that is actually a good thing. It will drive you not to make the same mistakes again.

I could go on and on here, but the main point is as follows. Trading is unlike most other businesses. It will expose your weaknesses very quickly. It is not something that will make you rich instantly. If this is what you want play the lottery. If you are a person who would subscribe to a service from someone such as Larry or myself, make sure you are ready for what it will bring. There will be many losses. There are no payoffs in life I know of that do not come with some risk. Even my dog rescuing efforts come with great financial and emotional risks. If you are someone who cannot handle adversity, get a salaried job and live your life. If you want to trade, get real. It is difficult, money will come and go, and there will be difficult times. If you succeed there will be very very good times, but the path to this is not a straight line.

Don't be a dumb ass like some of the subscribers who bailed out of this so fast.

Psycho babble over!

Tuesday, March 20, 2012

I WILL GIVE THEM THIS, THEY ARE CONSISTENT


One of the things I do respect about Gold Bugs or any other people who become fixated on one asset class and think it will rise forever ( see housing circa 2005, Internet Stocks 1999 ) are the incredible faith they have in their view. Having faith in what you are doing is imperative to have success in any walk of life. If faith matters these guys will all be billionaires. However, blind faith can be very dangerous, it can lead you right over a cliff. I used to be a systematic trader, and I can tell you nobody had more faith in what they were doing than I did. As I watched my Bond and S&P systems rake in the money, boy did I have big plans. However, a funny thing happened on the way to those big plans, things changed.

One of the qualities that most great traders have and also great athletes have, is the ability to adapt to changing conditions. One of the constants in life is change. You have to accept that having rigid views on things will only be in sync with what is happening for certain periods of time, then they will be out of sync. During the times where there is harmony, that is where you have your success, but at some point you have to be willing to dismount from those views before they bring you down. I have written about this before, but just to mention it again, it was having flexibility that saved me from ruin when my systems crashed. In the case of my Bond system I was actually able to realize it was going to fail before it even had a losing trade. I actually had a profitable year using it the year it crashed. I was able to do that because I was not so rigid in my views that I did not see the writing on the wall that it was headed for trouble.

When I saw that writing it was profitable for the year at the time, and I decided to stop trading it because of something I saw developing that I suspected was going to cause it trouble. As I sat back and watched it literally crash right in front of me, I was very proud of myself that I was able to see it coming. What I see with the Gold crowd is a blind faith that no matter what happens in the world every day, every week, every month, and every year, they see the price as rising. This degree of one sided thinking is dangerous. It would be just as dangerous to think it would decline in perpetuity.

My favorite group, I will call them the Gold Bug Group ( not their real name ), issued a statement today citing various experts who claim Gold is the most hated it has ever been in history. They cited some Sentiment report I have never heard of in supporting their argument. How do I know? I get their emails unfortunately, but I like to read them because they are always so negative on everything that it is good to hear the other side at times. I am sure if you go farming you can find fresh veggies and in the same vein, if you go data mining, you can find something to support your view for a trade. I have the same Sentiment Index I always use displayed on the chart. It does in fact show the it has gone into the negative zone. It does not show that it has gone overly negative, there are more negative readings you can see just on the screen without having to go further back in time.

To their credit they did say that negative Sentiment means more in an uptrend than in a down trend. This next chart shows examples of this.


You can clearly see here that when we had that strong up trend, and sentiment reached negative readings where I have the 3 arrows, great rallies followed. This is the correct way to use sentiment. As you can see on the right side of the chart, we have now entered a down trend. The way to use sentiment now is to look for it to be bullish on rallies to sell. That is exactly what I did in entering the Gold and Silver trades I am in. These trades are now profitable enough where even if my trailing stop is hit they will be exited for profits even if they don't become big wins.You really want to sell rallies in a down trend and using sentiment to time them is a very good way from a fundamental perspective to do this. For all I know the current trades I am in are not spectacular, but they are in sync with the trend, and that is the goal. The Gold Bug Group after acknowledging the trend was down quoted some expert whose opinion was that Gold was in a long term up trend and therefore the current price trend should be ignored.

This is the type of thinking that is very dangerous. Buying dips in a downtrend is not the same as buying them in an up trend. It may work, but the odds are not favorable regardless of what sentiment is telling you. You need to have the trend in price line up with your views, if you wish to trade like that. In fairness to the Gold Bug Group, the commentary did say you could wait until the trend turned back up to get long again, and it still would be a good trade you would just miss some of the gain. That again is correct thinking. Let to trend confirm your view, then double down on Granny if you wish. Do not be blinded by your view.

I would not be surprised to see Gold and Silver bounce here, they seem to want to hold the level they hit today. However, I don't use that type of subjective thinking in entering or exiting trades. It is merely an observation.

Good Trading


Monday, March 19, 2012

MY COUSIN VINNY


It is hard to believe by looking at this photo, but my little boy Vinny is 6 months old now on his way to being Howard Huge, and when I saw this going on in the front yard it reminded me of what I spent the whole weekend doing. I have been tortured by one inconsistency in one of my short term trading approaches. I have literally gone back and forth with it for 3 years trying to get a consistent read on exactly how to handle one particular aspect of it. I finally decided I was going to take the rat by the tail and get my arms around this issue. Vinny felt compelled to do the same thing with that pesky hose in the front yard which now is full of holes. On the other hand I was trying to patch some holes.

Here is the dilemma, look at the chart below.


My dilemma over the past several years has been, where in the hell do you enter these trades when you have pullbacks against an established trend? I have concocted one goofy indicator after another trying to get me a leg up on this, and none of them have really worked. I love these guys who post charts like this with lines drawn and just make it look like you would never lose just playing these flag or whatever you want to call these patterns. If you look closely at most of these corrections, there were several instances of a prior low going just to have the price continue to rally against the trend. Each and every one of these was tricky in terms of determining where you would short the market. It is always easy after the fact to draw in these lines, but it is another matter entirely to trade them live as real traders know.

I do have other tools I use that help me ferret out many of these fakes which I don't show here, but the net net of this is, reading the price patterns is still quite a challenge. You can read book after book talking about magic patterns and how they help to enter trades. It seems everyone has a different spin on this. My spin is that it is all hog wash. One of my favorite takes on this is "reversal bars have correctly predicted 5000 of the last 37 major tops." I hope you get this. In other words they are wrong most of the time.  Here is the same chart with reversal bars for sells highlighted in red. You can see for yourself that this is barely a 50/50 proposition.


I could label many other bar patterns that supposedly are magic and you would see the same thing, some work some don't. I have systematically tested just about every type of bar you can imagine and have found no edges at all to any of them. Studying collections of bars is another matter in that it is almost impossible to program them correctly. Even if I could I would not bother taking the time to do it. The solution to this dilemma is one of two approaches. First, you either enter at the market on a pullback with a Williams %R type of approach, and carry a stop at the dollar amount you are willing to risk. This will work until you either have a deep pullback or the trend changes. In those two instances obviously you will get stopped out for a loss. The second approach, which is the one I prefer, is to wait until you see the trend reasserting itself and sell on weakness.

This approach is somewhat of an art, but I think you can see from looking at the first Coffee chart where those instances are. I developed something somewhat mechanical to take the subjectivity out of this but that is hardly necessary. The net of it is that I will wait for the momentum to obviously turn back in my favor before entering the trades. It is up to you exactly how you approach this, but I would suggest that just waiting for the first low to get taken out on a pullback in a downtrend is not enough evidence to be consistent trading these little flag patterns.

In the mean time back at the ranch, the up trend in equities and most things for that matter continues. We just slowly creep day after day. This is a very difficult move to trade so be careful and be patient. You have to wait these things out some times. Do not try to impose your will or opinions against a move like this, trading cemeteries are full of people who tried that trick.

I do plan on launching my web site soon where for a pretty small fee you will have access if you wish, to more specific things like the research above I mentioned. I plan on pricing this very low to attract people to it.

Good Trading


Saturday, March 17, 2012


CLARIFICATION


There was a nice comment posted in response to Friday's post that I responded to in that thread, but it also made me aware of something that I need to address. When you host a blog like this there are new people coming in all the time and at times they will not go back and read what I have written previously. They will not know if I was bullish or bearish a week or two months ago on something, that I may have a different view on today. There is nothing I can do about this. In the comment I am referencing above it was mentioned that my bearish view on stocks might have influenced him or her. For readers who have been here awhile, you know I was very bullish at the end of last year when most people were not. I showed a trade live where I legged into a position on that nasty decline in November in both the SPY's and some index funds in an IRA I trade. I am long since out of those trades at this point.

When I look at my returns I tend to make about the same amount on both sides of the markets. All traders know that short profits tend to happen faster due to the nature of how markets trade. They tend to be sharper in price and shorter in time. Bull moves tend to stair step upward. This is just a general characteristic of how markets trade. As a result profits on shorts tend to happen faster and the longs tend to take a little longer to develop.

I also often show the COT data, and at times I heavily bash that data. It is important to understand what that data gives us and what it does not. What it does tells us is who is doing what, more or less. Occasionally those brain surgeons at the CFTC give incorrect designations to funds that cause market mishaps. We cannot control this and also will never know it is happening when it does. The only way we can account for it is to realize that reading this report is an art on steroids. It has taken me a very long time to get the hang of this damn thing. However, a very important point needs to be made in regards to this and it is evident in the chart above even though it is not shown. When we get a trend like this, COT data is really of no value at all. They will often just show them selling more and more as prices continue to rise. As traders this is not a sell signal, it is meaningless.

I would argue that even knowing if the Small Specs have their largest short position in history like they do in Unleaded Gas here, is meaningless also. We will be able to go back when a top forms and see that yes they had this position at the time, but how deep are your pockets? Do you really want to short that market right now? I don't! If we were to have a trend break and high test, while that same COT condition exists, that is another story entirely, and that is a trade I would take. It is imperative that the COT report be viewed as a tool, nothing more. It can be a very good one, but like any other tool such as MACD or RSI etc.., you have to know when to listen to it and when not to. This takes time and experience.

With the thought in mind that when I post bigger picture setups, it does not mean I am trading in that direction the next 5 minute bar that shows up, I want to point out a few things on the chart above of the Dow. I have an overlay with the VIX in green on this chart of the DOW, and have drawn a line at the levels in the past where problems have developed. One mistake that people make in using the VIX is looking at absolute levels, they can change over time. What we see in this chart is when the VIX has dropped under 15 in all but one instance, a good sized decline has taken place. You can certainly argue that all of the circumstances with these readings are different, but how complicated to you want to make things? I don't find that type of analysis makes me any money. A number is what it is in my view. What is more important is what you can see on the next chart, what the VIX has done on a relative basis in the short term.


The bands on this chart are just 10 day moving averages plus or minus 10 and 15 percent. You can see when we have closed outside of those bands on the down side, typically a decline has followed. We just did that a few days ago once again. You can see that the recent buy point in the market had a close outside the top band right on the day of the low. I was aware of this at the time but my short term tools did not give my buy signals, so I did not catch this move back up the last two weeks. I also do not have any short term sells yet, so there is nothing for me to do here. However, because of this as well as the larger picture where we are under 15, I have to look to the short side here. I am just looking for a trade, not a world ending wipeout to the down side.

Here is how things look with new highs vs new lows on the NYSE here, again a negative divergence.


Once again you can see that there is some underlying weakness that is not showing in the broader averages readings. The New Highs less New Lows is not advancing and it not in new high ground for this run. This is a negative divergence. You can see in the midst of the heart of this trend price and this index were completely in sync with one another, that is how it should be. The advance/decline line is still very healthy showing new high readings, but from my research New Highs less New Lows is a much better indicator of market turns. Study it yourself and draw your own conclusions. This indicator also does not turn the market on a dime in general, although at the lows on the far left of the chart it certainly did. If you are short term momentum trader, or a day trader, this type of stuff is irrelevant. If you trade like I do where you are looking for where the next likely large swing is going to come from, these types of things are more important.

To sum up my view on this, I see no reason at this point to short the market. I do see some things that are telling me that we could be heading for some trouble, and as a result I am looking for sell signals up here. There are none in sight at this point. In general I don't like to buy markets that are this extended, but if for some reason my short term signals give me buys I will take them. There are no buys close to being there at this point either. I am looking elsewhere for trades right now.

Good Trading


Thursday, March 15, 2012

IS THIS CAPITULATION?


I found this chart very interesting, shocking actually. In the world we live in where everyone has absolutely gone nuts, certain advisors have gone all in on Gold every day every week every month, seemingly for the last several years. To their credit they have been correct and their clients have done well who have listened to their advice. Many but not all of these guys don't even trade, they make their money from subscription fees. As a result of this they get very one way in their thinking at times. Even when they have good ideas, they often fail to see when one has run it's course and is due for a reversion if not an outright reversal. The only way you can truly learn your lesson, is to really get burned in your pocket book. I am not talking about losing subscribers, I am talking about having a big investment lose you 50% or more.

As we know with all bubbles, the roads are littered with folks who lost everything not just 50%, when they peaked out and reversed. As I have said, I do think this is on the verge of happening again in this market. Of course we also know many people do not agree with me. I don't care, this is my blog, my thoughts, and the trades I make. Everyone is free to have their own opinion. If you think I am a moron go start your own blog and call it CJ is a dumbass.blogspot.com. The above chart is out of an advisory service who just recently told people this was one of the best times in history if not the very best, to be a buyer of Gold stocks. I was shocked to see that just a couple of weeks later they appear to be saying uncle. In the back of my mind this makes me wonder if maybe I shouldn't be bullish? If the most bullish group in the world has given in, could that actually be a buy signal?

NO

The whole idea of capitulation is that you look for things like this at extremes, when price has gone a very long ways up like the Nazdaq right here, Housing in 2005, or down like stocks in 2009 etcc. In the commentary from these folks I will give them big kudos here. For a group of people who would have taken out a third mortgage on their grandmother to buy gold at the beginning of the year and even up until just a couple of weeks ago, this might be a very timely change in their view. One of the biggest challenges in trading is having conviction in something enough to make a trade and risk real money on it's outcome. When you get a big move in your favor like Gold has made, and you have a home run on your hands, it is very difficult to do a 180 on that view. I have a hard time with this as well, which is why I am more of a short term trader. I get wanting to buy buy buy grandmother, but then quickly selling her at an early sign of trouble is really difficult to do.

One of the things that I have mentioned as a reason why I think we are in for a very big decline in Gold soon, is a characteristic of all bubbles. There is a stage where the masses realize they have got some trouble on their hands, and they rush for the exits. Those exits get very crowded very quickly and markets become illiquid ala the flash crash day. At some point when this market does start going down sharply, their will be a point where the big proponents of this whole story are going to say uncle. When they do that what we will see is going to be something people will never forget. We have started to go down a little bit here but we are not anywhere near this critical mass inflection point. I think that level lies under $1500 where the obvious support lies in the Gold market.

In their commentary the above advisors who shall remain nameless, did say in spite of their still bullish view, they have to defer to the charts which say the trend has broken. If by chance the market does break hard from here I am going to give these guys their due by name. They will have done a very good service by their clients in telling them not to buy now, when just literally two weeks ago they said it was the best buy spot in history. This would be an incredibly prescient change of view.

I keep finding myself staring at the Naz chart in amazement, I have never seen a stock market rally like this one in all my years of trading.


There are several significant problems I see now with what is happening, and it is time to be very careful here. First you can see the commercials have been heavily selling this rally. You can see what good it did you to know that, none! This goes back to what I have said about this report, it is an art not a science, to read it and use it properly. Selling in a huge up trend is for the most part a normal pattern and is not bearish. Here is what is really bothering me now, the last two panes on the chart. First the ADX. After hitting the record high I pointed out in here, it has come down. This was to be expected. However, price has not. ADX is a measure of trend strength, you want it rising to support trends whether they are up or down. When you have a price move where ADX goes the opposite direction, that tells you there is not a confirmation of the trend. You can see it was rising the whole rally until recently. At this point we have now made that new push up and ADX is making a huge divergence. That is bearish.

At the same time we see that the ratio of new highs to new lows has also failed to make a new high. When I combine these two together we essentially have a sell signal, or as my dad would say "that's horseshit." If only I could fully convey the tone of disgust in his voice when he says this it would be a lot funnier. He is not a trader in fact he would not know the Naz chart from two in the bush. This is just a phrase he uses. What to do with this?

First, don't buy anything. If you are already long which you should be, tighten up your stops. We are likely to have a trap door open here any day now. However, from a short term trading perspective, I do not see any sell entries right here. If you are a position trader and like to play the market from both directions, this would be a decent spot to start legging into a short position. That type of approach is not one I use, so I will not be doing this as tempted as I am. I am very tempted! Things like this are not always actionable intel so to speak, they are just things to be conscious of. If and when I short the indexes I will post it here.

Good Trading


Wednesday, March 14, 2012


DECOUPLING


We appear to have had a day where things are moving back to normal in the markets. The dollar and stocks moved together, and other markets were "allowed" to go their own way. We have not seen this in quite some time, and it is too early to say the trend in this has changed, but let's cross our fingers. The Gold short I mentioned was initiated above where it is marked, and I also shorted Silver which has not fallen as much, but did play catch up some today. Since it is my well documented big picture view that we are headed down here, I am going for a big target on this one, marked on the chart. Rarely are moves that big so I have no expectations, but I have a plan and we will see what transpires. If the move continues, the DZZ trade I showed yesterday will also work out. There was a question about the Silver target. I see two there but 2780 is the main one.

VISION QUEST UPDATE

My mission on B of A has gone nowhere, the first trade I exited and lost a couple hundred bucks the day after I got into it, so basically a scratch. It broke out upward yesterday, so there is no opportunity that I see on the horizon to short this. I will watch it every single day for something along with Douchefetts stock. His stock looks the same, a big breakout yesterday. I would assume everyone has noticed that these stocks and most others look identical to the Indexes. I see no need at all other than some goofy quest like I have here, to trade any individual stocks. Unless you are a value player, which is a different story entirely. If you are a short term trader, skip individual stocks and trade the indexes. They are much more liquid, and they are almost all the same chart patterns. This is why funds can't beat the indexes. You have all the overnight gaps to deal with, and they mostly move with the overall stock indexes. As a result you have bad fills and hence under perform the index itself.

There is no point in trying to short any stocks at this time regardless of my stated mission here.

Here is something a little different from me, a great dividend stock to buy on weakness, Annaly.


You can see that even at today's price the yield is almost 14%. These guys are in the mortgage business but have nice backing in that the government guarantees their loans. Do your own research on them and make your own decision. You can see I have an alarm on my chart for when the price dips down into an area where the yield will likely rise above 15% or higher. I will be a buyer for a hold the next time we get down there. Who knows how long this could take, but it will get there again. Maybe during the decline that we should see in May it will get back down there. In any event I have this alarm in place so even if I forget about it my machine will remind me. I like the idea of dividends but what gets lost in just buying stocks for that alone, is the principal. If the stock declines 15% and pays 4% in dividends you have had your ass kicked net. You have to buy them right, not blindly.

It does also look to me like energies are in a spot where they could come down some, although selling RB requires a pair. The Bond market has fallen off a cliff the last few days. It fell from the middle of a trading range that has been a mess for months, so missing that does not bother me. I have been short the currencies the last few days and they have moved down some. I am surprised to see it with the equity strength, but if I had to guess it is a collective sigh of relief effort, and the flight to quality is going back to where the real quality is, the good ole USA.

That is all I have for now.


Tuesday, March 13, 2012


REACTION


I have been digesting some of the comments and it seems for the most part people like what I am doing here. There were some requests for a bit more of the logic of the actual entries, and also some about how to handle the realities of the ups and downs of trading. Also one about why I do this.

Here above is an example of a trade I am in, long the DZZ which is the double short ETF for Gold. Since I am short the futures now and also have been bearish as readers know, I decided to leg into an ETF position as well. I have on the screen the Force Index, which is an Alexander Elder creation that seems to work well for divergences at extremes. I have marked one off at the low. I have found that when a divergence occurs with this when the market is extended past a volatility band of some type, the markets often change direction. In this case I just have standard deviation bands on the screen, but Bollinger Bands would probably also work fine. In this case it just gives an idea, that a significant low could have formed there. We then proceeded to base moving sideways for quite a while. All I have done here is buy into weakness at a time when I think the futures are setup for a decline, as this is the inverse ETF that rises on a price fall.

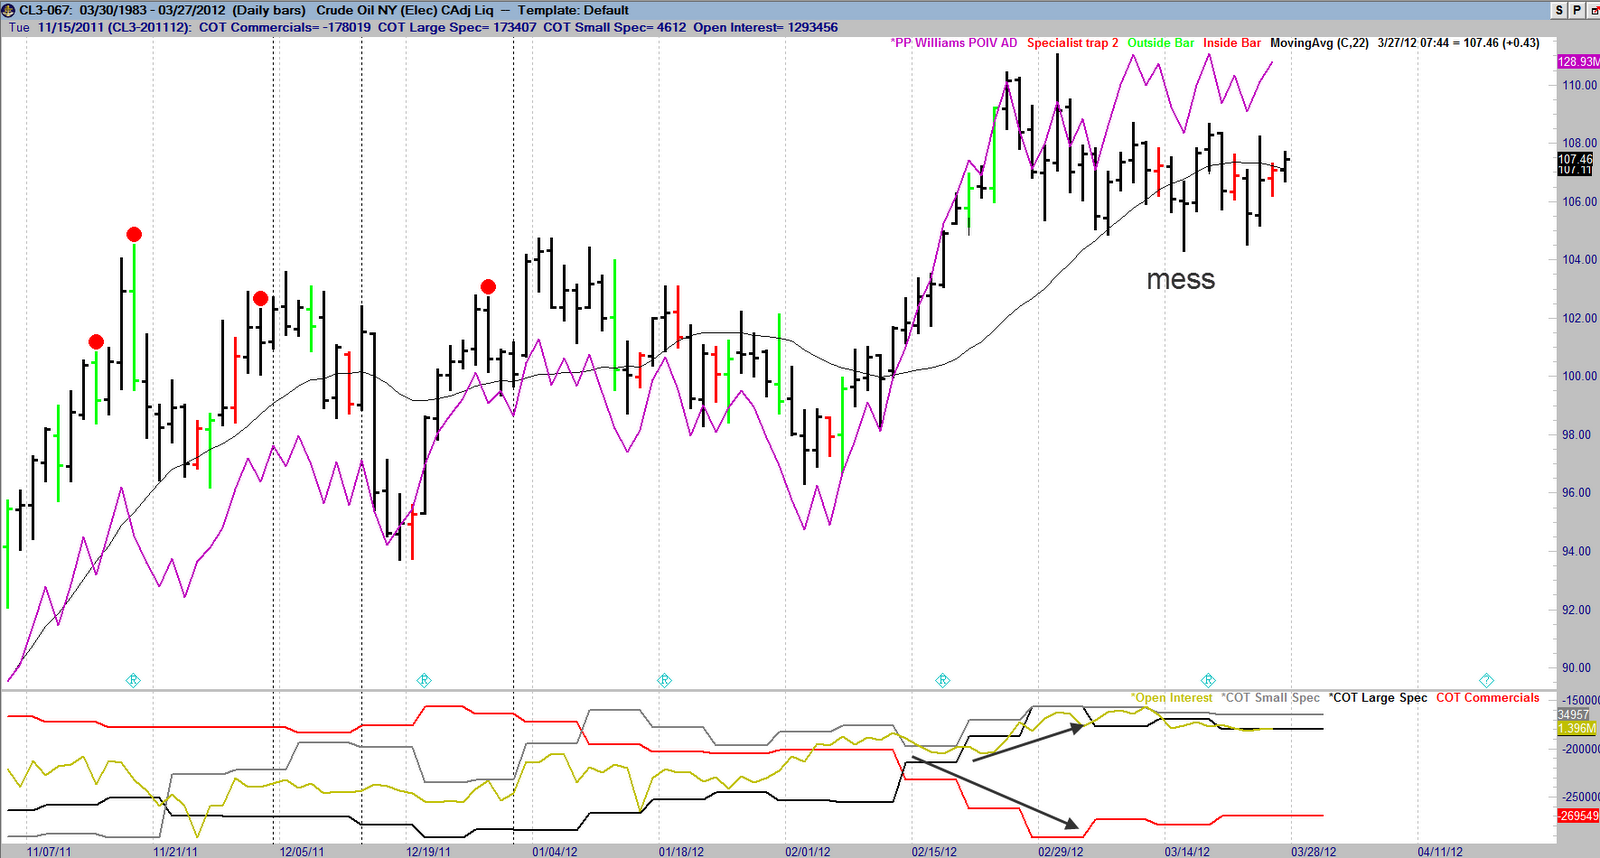
I would love to sound smart and tell you there is more to this trade than that but there is not. Most of my trading has pretty consistent logic as to when I do what, but how I get into the trades varies quite a bit. I wish there was a way around it but there just is not. The markets are full of random activity, and I cannot impose my will on them even though I would like to. For the most part, I buy above prior highs and sell below prior lows, when my other tools tell me the time is right. I use pivots to give me the structure of the markets and identify trends. Beyond that there are a few things that I am not going to disclose here. They are tools that I have put in painstaking months and even years developing and or learning to use, and they are just too valuable to expose. I think I give readers more than enough information to do their own research on certain things. Here is another chart showing this tool and how it picked the top in the DX. You can see the only divergence that occurred outside the bands happened right at the high. Put this in your tool box. Just like anything else, it is unwise to go nuts with this or anything else. Just check in on it from time to time to see if it is speaking. Do not put it on a 3 minute charts and scalp with it.


You do need to find your own way in this business and it is not an easy road at times, which leads me to addressing the one comment that came in yesterday. It is true my trading has been sub par lately. I mentioned at the beginning of the year that markets running like the stock market is tend to be difficult for me to trade. I trade both sides of markets, so when we get this quiet creep, I just don't get as many trades as I would like. I have also had an avalanche of difficult situations with my animals over the last 6 months, and at times have been so upset I just did not feel like doing anything but existing for a day here and there. I try to keep in mind the greater good we do rescuing all these wonderful souls, but all the tragic deaths at times can be overwhelming to me. This has effected my trading without a doubt.

I think it is imperative if you are thinking about making this your living, that you establish a good pile of money to be able to draw from. You don't want to get into every time you make 20k having to take it out of your main trading account to pay the bills. Maybe you develop a side business that brings in money, or maybe you do this on the side while your main occupation is something else. Going down the road of just opening an account, and hoping to just make millions and leave the worlds troubles behind, is just not a very good plan. Most people that do that lose everything, MOST! As they say "don't be that guy." There are people that have done this and will do it again, but be smart about what you are doing.

My largest draw down has been 17% since I became a profitable trader. Most people would say that is nothing, and some would not even believe it. I can tell you that I have enough money in my accounts where 17% is a lot of money, that period was brutal, it occurred during 2010. Keep in mind that during that period I was also forking out 20k a month to pay bills. This is the reality of things. You may not have overhead like I do, hopefully you don't, but no matter who you are this is going to happen to you. Buying those psycho babble books about the emotional aspects of trading and all that other stuff is just crap. You have to suck it up. Life can be wonderful, but there is no guarantee it will be easy. Just turn on the news any given night if you are not convinced. I remember having a terrible time with one of my dogs I lost in 2010, I covered that loss in here. I still think about him every day. I was in the vets office recently and he came up and he asked me if I needed to talk to somebody about it?

What exactly is that going to accomplish? I am going to lay on a couch and spout off all this crap while some geek just sits there and listens, and pay him to do so? The bottom line is that he was a big loss for me, and if when you lose someone important to you if you don't feel deep pain something is wrong with you. That is part of being alive. Trading has very difficult periods there is absolutely no way around it. You need to setup your life so that when they happen, they don't ruin it. This is not quitting your job, opening a 50k trading account, buying a new Porsche and being a big dog. It is about grinding out a living, learning from your mistakes, and moving forward. Tiger Woods could be a trader right now. He falls from a perch higher than most ever get to by his own doing, then has one up and down after another trying to get back to the perch. He seemed to be hitting the ball as well as he ever has recently, the equivalent of a good winning streak in trading. All of the sudden he gets injured, the akin of a draw down. Now he will at some point I assume, try and come back again and get it going. Will he be able to? Who knows, but his saga is very similar to that of a trader. We just get to watch it live.

As to why I do this blog? 

There are several reasons for that. First, selfishly I thought if I could establish a following, I might be able to morph it into some type of a revenue stream some day. What form that would have I don't know. I am hesitant to get under Uncle Sam's thumb which is where you wind up once you launch a web site. All the new regulations that are being created make this something I probably need to do from another country. If we get 4 more years of Barry this will only get worse. As a result this is something that I am still considering, but nothing is pending.

Second, I felt there was a void in that a product like what I have here did not really exist. There seems to be just one BS pitch after another out there. Charts that show buying every low and selling every high. Just join them and partake in guaranteed riches. I can assure you that if someone really had something that would do that, they could make more money trading it than selling it and not have the liability exposure with subscribers. These folks are all full of crap. I thought people would appreciate someone talking about real wins and losses, dumb mistakes, some analysis etc.. In this area I think I have accomplished my goal

One other reason I do it is that when you put something in print on the Internet you better damn well be sure about what you are saying, because it will travel around the world. There are readers of this blog from every country on earth. It is helpful in my own trading in terms of conviction with trades, to be able to state where I am looking in a public forum. I have backed off a little bit on live trades due to concerns about liability. I don't want someone suing me because they claimed I told them to do something or they saw I did and went along and lost money.

I have wandered my way into the short side in a few things over the last couple of days, markets I have talked about in my setup commentaries.

Good Trading


Monday, March 12, 2012


SHORT ATTEMPT NUMBER TWO


Here is the makings of short attempt number two for me in the metals. I know we had some dialogue about the supposed bullish readings in the COT report last week. You can clearly see on the chart why I said there was some buying but nothing significant. How in the world someone could look at this and ignore all the massive selling that has gone on during the whole rally, then cite one major little wiggle up and claim that was record buying. I am not trying to pick on anyone, but what I am trying to do is show people why having a bias can blind you to what is really going on. Even if you are a perma bull, wait for more than this, to say this is insignificant I think over states what it is. The trend is very clear as to what is going on in terms of the commercials here in the Silver market.

My short term indicators are close to rolling over here and they will on any down move that starts now. It is time for me to take another shot at this, and I do have orders in. I am hoping tomorrow closes up because that sets up my patterns better, but we don't always get things perfectly lined up.

We do seem to be set up on the short side in many places right now, and what is probably stopping them from really rolling down is the ever upward stock rally. It may well be that it makes the trades not trigger or if they do, not work too well. However, that is conjecture, and I have to follow my rules of trading. My opinions always lead me astray so I really try to store them where I can't find them like a drug addict trying to kick a habit. In general I think Gold is tad weaker than Silver, but my short term indicators are better sells in Silver at the moment. It is basically the same trade so I doubt it matters which one I trade.

I do like the fact that the last big pivot before the rally has been taken out, this tells me there is a trend change at hand. If we were to start making more higher lows after one another that could turn the trend back up, but that has not happened yet. For now the trend is down, the COT stuff is bearish, my short term indicators are bearish. That tells me to short this. I may get smoked, but I will follow the rules.

The overall market just keeps plugging along nicely. I do admit I was looking at sell signals potentially but those setups barring a trap reversal play if tomorrow closes above the old highs then reverses the next day, are off the board. My tools I admit do not work well when you have a market that just runs one way this long without any corrections. I am not sure if any tools do, other than the basic moving average crossover method. Of course that method only works in this type of environment which is the problem with it.


The big difference in my mind between this and Gold and Silver is the trend. Here we have a huge up trend, so although the small specs being this long is a problem, commercial selling against long term trends like this is not necessarily a sell signal for me. It is best to look for selling in a rally in a down trend as opposed to them just hedging rallies like this. There is an art to reading this report as I have said many times. As bad as this looks, to me it is not a raging sell signal other than I am concerned about how long the small specs are. This is never a good thing for a rally. Picking a top here is a fools game in my opinion. It does appear our Euro predictor chart needs a life line here to be correct. It's perfect game might be broken here unless we turn right here.

It is my bet that most of the sells I am trying to get into are not going to trigger unless the stock market has some type of setback, but I will place the orders and see what happens. I wish I had more buy signals, but they are just not here.

Good Trading


Sunday, March 11, 2012

GOING FORWARD


I am debating exactly how to go forward with the blog. I have a few ideas of changes I am contemplating making. Please make comments about what you like and do not like about what I do here, but keep them professional. If you are a homer for something and I have posted things in the opposite direction, I don't want comments about that. I trade in two directions, so at times I will be bullish or bearish in individual markets. Please do not comment on why I am bearish on something at one point in time if you are just always bullish that market no matter what happens. What I am looking for is in general what is liked and disliked.

The above chart show something that has just come up regarding the COT data. I have learned to read this data from the two best analysts of it that exist, Larry Williams and Steve Briese. My analysis will not always be correct at times the markets move contrary to the way I analyze these reports. That is life folks, I know nothing in trading that is 100% and if I did you can damn well be sure it will never be mentioned here :).

As it is with anything else you need to look at this report objectively, what is it saying? Is it saying anything? It is typical that it does not give direction. If you look at every report with an agenda, it is worthless. If you are a perpetual bull like reader Robert, you ignore all the bearish setups and find any little wiggle to support a bullish stance. If you are a perpetual bear like others, you ignore all the bullish setups and just find one weak when sellers out numbered buyers, and proclaim it is a big sell signal. I prefer to let the report tell me what the players are doing instead of funneling them into my own view. Last week is a perfect example of this in the metals. You had some buying by the commercials in Gold, but not anywhere near enough to generate a buy signal. The buying in Silver was so small it barley moved my line yet some people proclaimed it was a huge bullish signal.

If we look at the overall trend in the above chart what do you see? What I see is the commercials generally selling and the small specs and large traders buying. I also see Open Interest rising steadily. This is a bearish setup. Yes it is true the positions of these folks did go back in the other direction this last week. If you are bullish you would say hey look at that huge buying... Please!!!!! Look at what the overall trend is and don't be a pinhead. What we want to see is significant trends in the activity of the players, not one week action. Robert who like so many drank the cool aid that millions have drank, and no matter what any report says, is bullish on Gold and thinks it will rise the next 20 years. These folks cite the recent amount of commercial buying which is not even half of the selling that has taken place. If you were watching a sporting event and one team had a 30 point lead and the other team narrowed the spread to 17, would you be convinced the team trailing was going to win? I wouldn't. 

My dad is a good person to pick on to make this point. I was talking to him the other day and he was down that Michigan had lost the first round game in the Big Ten basketball tourney. I had read the paper and saw that they won that game, so I asked him what he was talking about? Of course they were trailing apparently with 3 minutes to go so he turned off the game and missed the comeback win. He was in a negative way just looking for signs that they would lose and ignored everything else. This type of bias can really rob you of many of life's great experiences. Look at things for what they are, do not assume something is going to happen. It may happen like you think most of the time, but there are going to be times when it does not. Just because you are convinced Gold will always rise no matter what happens in life, have a plan just in the 1 in a million chance that you are wrong. I can assure you from personal experience, that I am never sure what will happen, and neither should you be.

If you are T Boone Pickens, I am sure you are so bullish on Oil now that the COT report showing there could be some trouble with that position means nothing. I my humble world I prefer to not have agendas and to lean where the data leads me. Even though I am very bearish on Gold in general for the reasons I have stated over and over in here, if we get COT data where the commercials turn into strong buyers on the next dip, I will be bullish. That will be where the data takes me. For now it takes me to the short side of Crude and Gold.

If you are a long term trader or investor, you should not be reading this blog. I am a short term trader and I play both sides of the market. There is no point at all if you are locked into one side in anything to be reading here, this is just a bunch of noise.

Good Trading