GOLD BUGS DANCING IN THE STREET
As I have said all along, I am not biased on either direction for the world's most popular market. Now that the COT report has come out, we have a buy setup for GOLD. I stated in the prior discussions about the COT data, that there was some buying but it was not enough to really matter. Now we have had enough for it to matter, and you can see the red line, the commercials, have moved back into a heavy long position. Open Interest has also declined as have the Small Specs. All in all a bullish setup.
I exited my short positions in the metals last week, when some of my short term things showed a lot of divergence, and price just seemed to want to hold. I also exited my DZZ etf position on Friday morning early taking a small gain out of that one. Overall all three trades made money, but were not big wins. I took a decent chunk out on Silver because I got in that pretty good and had a lot of contracts.
I don't really have a daily buy signal at press time here, but I have yet to really look at this closely. The net of this is that we now have a fundamental reason to look long. This should be a lesson to folks like our resident bull in here Robert as to the use of the COT data. I just look at it for what it is without a market bias. I don't ignore buys because I think this market is a bubble. I am a trader, I trade the signals, and don't pass off data that does not meet my view. I am looking for buys in Gold this week. I could give a crap about all of this talk such as it is a store of value, it has never gone to zero, blah blah blah. That comes from people who don't trade who are making commissions selling you something. They are essentially realtors. I love the Gold Line adds where they give you free the monthly newsletter that is a "$25 value." Who in the world would pay $25 for something that just says the price will go up no matter what happens? Don't we already know what it says? Isn't it just four words on one page GOLD WILL GO UP? There I just saved you $300 a year, you will able to afford my web site now.
I want to revisit our artist formerly known as the mystery chart now known as the Euro COT position. The question is, has the refusal of the market to decline here indicated this predictor is no longer useful?
I think the answer to that is no. If you step back and take an overall look, what is this really saying? Ignore all the little minor wiggles, where are the major moves? To me the very short term top this had predicted is really a wiggle, the overall prediction is a significant continued rally after a pause. It really shows significant upside starting in June, more than it shows a big crash that should have started. This is how you have to look at things like this. It is a road map, it is not going to give you an exact day to scalp 5 poinst out of the ES on a tick chart. The fact of the matter is we have a huge bull market on our hands, and I see this as really supporting a much larger move coming.
Some folks I am sure would say the economy is no good so how can this keep going? My answer is the economy has nothing to do with the stock market. The Federal Reserve controls the stock market not the economy. This is also why the COT data does not work in stock indexes any more. The real commercials are the FED and their data is not in the report. They have pretty much told everyone to pound sand who has asked them to disclose what they are doing. They are never going to open their books folks, get over it.
The real research project would be to create in indicator that displays what the Fed is doing every day, and substitute that for the commercials position. I am not quite sure how to do that, but it would be worth the effort. Even though we did not get the little 3 month pullback this has called for, it still could happen, you can't babysit every single day on this. After all, this is the commercial position in the Eurodollar market projected 12 months into the future. How could we possibly expect that to pick exact dates for us. Even if it remains generally accurate it is a miracle to me.
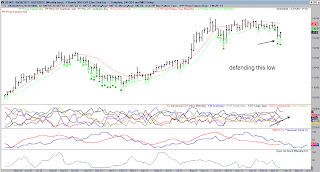
For those kissing the Bond Market good bye I would hold that thought for a bit. The next chart shows a good buy setup for Bonds.
The commercials appear to be attempting to defend that last significant low on this chart buying into this decline. This is a buy setup like that of Gold, so I am looking for buys here.
Good Trading this week


2 comments:
So ES, Gold and Treasuries all going up? I know we shouldn't trade on correlations, but I'd be surprised to see all three of them go up together
all going up?<<
CJ Knows when you have a deity like the Bernank, all this is possible. He has the magic helicopter and he knew exactly what to do in 2007-2008, if you will recall.
(Caution helicopter crashes can be ugly).
Post a Comment