DISCLAIMER

PLEASE READ THE DISCLAIMER AT THE BOTTOM OF THIS PAGE WHICH APPLIES TO ALL CONTENT IN THIS BLOG AS WELL AS ANY OTHER MATERIAL FROM WE ARE FUTURES TRADERS LLC. READING ANY CONTENT BELOW CONSTITUTES AN AGREEMENT BY ALL READERS THAT THEY HAVE READ AND AGREE TO ALL THAT IS SET FORTH IN THE DISCLAIMER AT THE BOTTOM OF THIS PAGE.


Saturday, August 29, 2009

HOT FOR TEACHER?


Great song by Van Halen, and also my mood. I guess I need someone to teach me what to do.


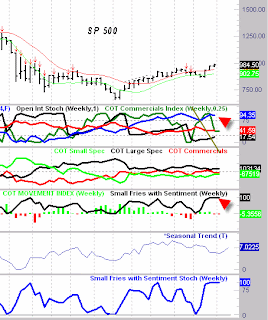
We have several conflicting signals at this point. To the left is the Pit contract for the SP 500, shows a very bullish picture except for the seasonals and a synthetic COT Index ( the red line in the top graph under the price ). This synthetic index has been a very good predictor of direction although not perfect. On the other hand the emini SP 500 looks almost the opposite of his picture, with very bullish sentiment and commercial selling. In general the emini has been the better predictor of price movement in the last 2 years, the volume is much heavier there.


What to do?


There is a new technology which allows projecting price movement matching recent activity, and if that is used as the tie breaker, it is showing a flat to slightly upward move for the next couple of months. Historically these maps have been pretty good. Also, there seem to be way too many people now calling for a correction. As the saying goes, what everyone waits for will never happen.


I am of the belief now that what is going to transpire is some type of correction in September, but it will not be a big one, then prices will kind of meander sideways for the balance of the year. I do have a short position on in ETF's the SH as I posted when I entered my first portion. I have added to it as we creeped a little higher. If we do get the downward move at the beginning of September, which I expect, I will exit this position. I no longer believe at this point that there is a large profit opportunity in this trade. It is marginal at best, and a scratch or a little better is probably the best that can be hoped for.


I will monitor all of my tools if a corrrection does occur to see if there is anything taking place that warrants a change of this view. I have watched one sell pattern after another either fail, or in the case of the Megaphone pattern, not get a fill on the orders. Failed sell signals are buy signals.


I have been of the opinion that the dollar would rally just because the crowd that is typically wrong, was very bearish. Even a blind sow finds an acorn, and they appear to have one in their grasp for once there. Of course if a sharp stock move down were to happen, the dollar is going to soar. At the moment that does not appear likely.


Part of trading is admitting when you are wrong and getting out without getting hurt too badly. I think the bulk of the upward move has occurred here but the trend is very strongly up and alot of historically bearish indicators are failing here. As a result, it is just not a good trade setup anymore. If we were to get a downward move then a quick retracement that failed the highs, and it was accompanied by commercial selling, that is what it will take to setup this trade well for a short sale.


I will be there if that happens. Back to my corner and wearing the Dunce cap for blowing this market call. Fortunately my trading was better than my market calls this month.
Sunday, August 23, 2009

Friday was certainly an interesting day. It is entirely possible that I am wrong about this top and we are just going to go straight up. There is certainly alot of political engineering going on with this rally as I have discussed previously. HOWEVER.....

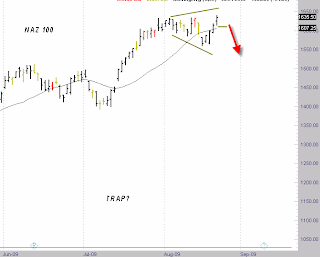
We now have a megaphone type pattern which I have written about in the past. I am certainly not the creator of this pattern, but I have used it often since I learned about it 10 years or so ago. Generally it is most significant when it occurs in extended market conditions like we have here. I like it when the legs of it have symmetry like this one. Also, if Fridays move were to be reversed just after making new highs, it would be a classic trap move.

Since the NAZ has a weaker pattern than the SP that is the one to short if a short play is made. Basically a close below Fridays low on Monday triggers this trade. As a short term trader I have to play this trade if it triggers and will probably enter it intraday if we go down. There are also a couple of other things I look at that are saying Monday or Tuesday could be the high, so my feeling on this is that if this is to be a top of any type here be it short term or long term, this needs to come down right now.

Friday, August 21, 2009

Add On Here

Now that we have gotten another push up, I added to my SH short position on todays gap up open above yesterdays highs. I do not know if they can keep pushing this, but these types of opens at times can be traps.

Keep in mind that this is a position trade not a short term in and out type of situation. Ironically some of these moves up are not being driven by the PPT, they basically show up on down days not days where the market is strong from the get go. If you google Plunge Protection Team, there is actually a couple of very good articles on them.

One thing the american public might not be too pleased with is to find out that some of the huge derivative losses in these large banks that got bailout money, were from PPT buy programs during last years wipeout downward. Interesting choice, they helped stabilize your 401k's eventually but also took your tax payers money to pay for doing it. I wonder how a poll would come out on that?

I have orders in to sell below yesterdays lows today in the SP 500, no idea if we get there, and also orders to sell at yesterdays highs, basically a gap fill trade. Also hard to say if that will happen.

Meanwhile back at the ranch, this overnight futures move has brought alot of commodity markets with it and they are setting up nice sell signals for next week. Unleaded Gas, Silver and Copper, and some of the currencies as well.

Lets see today if the gap holds, the intraday trade has been so light lately that it is possible we just move sideways all day from this open, but we will just have to wait and see. In a normal market time, this gap would have a decent probability of being reversed.

Monday, August 17, 2009

Buck You!

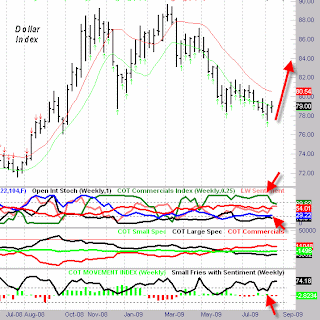
This is a market that in all honesty I have been wrong about recently. If you look at the green arrows on the weekly chart of the Dollar Index, they represent buy signals or buy areas based on fundamentals.

Recently many of these have failed, which could be argued is actually a sell signal. In watching the price action of the markets, I have a completely different view than most people, be it right or wrong. When I watch the intraday ticks, I see the dollar reacting to stock prices, not the other way around. Some experts are claiming the dollar is driving everything, I say stocks are, in other words the opposite of that view.

I was recently in a Heating Oil short that wound up being my best trade of the year, just exited it. During the trade it was evident that every time the stock market rallied 50 points, Heating Oil also rallied. There is absolutely no historical relationship between these two markets. However, recently since the economic downturn, really the only ray of light has been the stock market rally. It has carried many markets with it.

In 23 years of trading I have never seen the almost tick for tick relationship between so many commodity markets, and stock prices. It makes absolutely no sense fundamentally. My theory is that some whiz kids at the funds have zeroed in on this recent phenomenon and created mechanical buy and sell programs for all markets based on this relationship. This is an overly optimized trade, which will eventually result in these funds getting clocked.

I have been guilty of over optimizing trading systems, so I speak from experience here. Getting back to the subject here, if I am right about this stock market top, it is likely the dollar will get a big lift off here as it seems to be trading almost directly opposite tick for tick, the DOW. It also appears that many currencies are topping here, so that makes for more reason to believe we have a dollar low.

However, my favorite reason for this call is that every wize guy in the world thinks the dollar is going to crash, and I love being opposite the herd even if at times I am wrong.

Looking at the arrows you can see the commercials have recently been heavy buyers, and sentiment was recently very low, the small fries with sentiment graph. Also, Valuation vs Gold was very low. These are all reasons to look for a rally not a decline.

Sunday, August 16, 2009

GOLD BUGS - I wish I could call Orkin on them

I heard on a popular radio show recently "once Gold gets to 955 it will go right to 1000." Actually once it hit that number it went right to 900. So just to define that, with commissions and transaction fees that are charged, if you bought at 955 for that free ride to 1000, and paid the close to 40% added fees to get the coins your adjusted basis is 1337. When the price went immediately down to 900 you had a brilliant loss of 46% on your "investment." This took place in about 4 weeks, at least the stock market took a year to take half your money.

I guess they have the right to decieve you, it is after all the american way. Figure out how to take someone else's money in a dishonest way. Ironically these people cite the same experts at the big brokerage firms and their expertise in making these calls. These are the same experts who did not foresee the housing or stock market crashes, yet they are now to be relied upon? A free information packet? If I hear that again I may just start shooting. They offer something free that will lead you to lose 45% in two weeks!

As you can see from the chart at the 3 points marked, every time the commercials have gone into the sell zone we have had declines. This is what really drives market action, not these god damn phonies trying to squeeze commissions out of you. Now we are in that sell zone again, so I would expect we will see another decline. I am looking for a short entry in the metals right now.

Saturday, August 15, 2009

LET IT BE, LET IT BE, LET IT BIE oh LET IT BIE.......


This is a great old Beatles song and also a message to the PPT. Why in the world won't you let the market just have a natural correction?


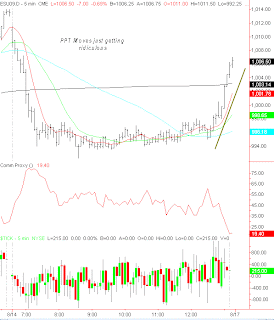
Here is a 5 minute chart showing the PPT at it's finest in the last few minutes of yesterdays market action. Of course I have harped on this repeatedly, and here is the real reason why I don't like this. This type of action is going to cause a V top and a huge downmove when at some point a fund liquidation area gets reached, and even their volume will not be able to stop it. I think had they just let a natural corrective move happen, this trend could have really had some additional legs.


It still could have, but if you go back in history and look at times when the government has tried to artificially control prices on things, eventually market forces take over and big moves in the unintended direction occur. It would be normal and healthy to let the market correct some here, but just artificially improving closing levels to stop it is just postponing the inevitable, and I think making it worse.


All that aside, this may allow for legging into more of a short position for me up here which will be nice. I was kicking myself mid day yesterday having not put my full position on, thinking I might have missed the opportunity. They really fooled me yesterday, I told many of my colleagues that I did not think the PPT was going to show yesterday.

As Howard Stern's father used to say to him when he was young, "Don't be stupid you moron!" I found myself with that thought at yesterday's close. What an idiot I was to state I thought they would not show up.

The next post will be on the dollar, we might be on the verge of a major rally there.

Friday, August 14, 2009

Time to get short


I rarely do this, post a trade right when I do it, but will take a shot at it today. I just put a position on with the SH etf to short this market on today's opening. I think with all the things I mentioned recently, along with the seasonal, and this tremendous divergence in this oscillator, it is time to look for the decline to begin.


I have no idea if it starts exactly today, but the only thing missing from making this a perfect setup is a heavier commercial short position. However, what has been happening recently is the commercials doing scale down selling and scale up buying. As a result, they are not giving us the advance notice they used to.


The negative in this trade of course is the PPT along with several funds that have every interest in keeping this up for as long as possible. The PPT for political reasons, and the funds just to keep their bonuses alive. However, at some point natural market forces are going to push this down. The public is just way too bullish right now as well as the advisors which is even more meaningful.


Valuations are very high also along with some trend measures reaching historical levels. You did read that right, on some levels this could be argued to be the greatest rally in history. One trend indicator I use has only reached this level one time ever, so by that measure this could be argued to be the biggest or tied for it, rally of all time. Keep in mind we have moved 50% or so in just a few months.


When all of these things get put together, it tells me this is the time to not only be out, but to be short. There are those last hour buy programs that have shown up every day like clockwork, and there is no reason to believe that will not continue. It might be the PPT, and most of the time it is, but it is also institutions as well. No matter, this trade is a hold not a short term play.

The challenge with this is going to be once the correction begins, how to guage if it is a pullback or a big picture trend reversal. I will tackle that when it happens. If we continue to creep up I am going to scale in more to this trade.

Monday, August 10, 2009

Here is a chart for those who doubt the PPT exists. This is the last thing of this nature I will post here. After this for those who still feel it is not true, just go elsewhere. I am only going so far to talk about this. With the communist regime we have now, there is no doubt they will come after me if I push this too far.


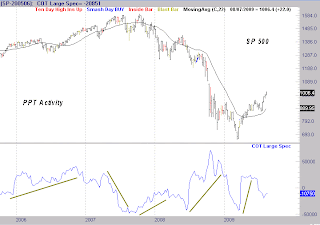
What I have here is a chart of the SP 500 weekly and below the position size of the large traders from the COT report. Large traders are fund managers and as a result are momentum traders. The typical pattern is for them to be heavy long at peaks and heavily short at lows. They typically buy at 20 day highs and sell at 20 day lows or thereabouts. They then pyramid positions with profits adding more longs as prices rise with the profits they have made, etc.. This is due to how they invest their money. However, what you notice on this chart time and time again, is actually heavy long positions on big pushes down. Since we know that large funds liquidate on these moves that leaves only one group left that can afford to lose this type of money to try and stop a move, the US Government.


Any fund would have been wiped out by riding a move of this size down, and none of them were in this market. Notice also how the positions lighten on upmoves, again the opposite of what fund managers do. This tells you that it is mission accomplished when the bounces occur and time to get out. It also tells you that since the overall size of the position in this category is going in this direction, the party doing this also has more money than anyone else in the game so they can overcome the total of what all the other players in this category are doing just by themselves.


This mystery component in the Large Trader category, acts completely the opposite of every else in the category. They also apparently have unlimited capital. They are not allowed to be classified as hedgers and get into the commercials category, so who could this possibly be?


This group has unlimited capital, and buys when prices go down and exits when they go up a little but still at lower prices than where they entered, taking tremendous losses time and time again.


There really is no mystery folks, it is the PPT. I do not see why anyone would be surprised by this with all the political nonsense that goes on every day. I really do not think this is anything to be concerned about in the least. Just get used to anticipating where they will show up and profit from it. They showed up right on cue last week right after I posted that chart. The argument is always that intervention just delays the inevitable, maybe so, but it makes the rides down a little smoother and I do not believe there is anything wrong with that.

The other interventions that are going on right now are far more disconcerting to me than this is.

Thursday, August 06, 2009


Crunch Time

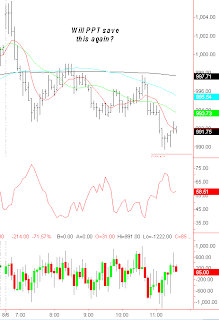
Here is a 5 min intraday chart setting up a prime PPT appearance opportunity. We know they are doing everything they can to hold this up until they get all the socialist programs passed if at all possible. There are several reasons why at the very least a correction would have under normal circumstances, already happened.

Interestingly enough, I do have a potential short term sell signal finally today if yesterdays low gets taken out. This chart shows us basically two ticks away from doing so. This time zone of 11:35 as I type this is prime time for these guys. Let's see what they do.

It has been easy for them to support this due to the light volume in that they have not had to commit alot of money in their buy programs to accomplish these end of the day lifts they have been performing. It more or less is proof that they are the buyers. However, at some point I think they are going to let one of these sell attempts through then try and support it after it drops a little.

They are under the spotlight right here so let's see what they do!

Sunday, August 02, 2009


ARE WE HEADING FOR TROUBLE?

I know these charts are hard to see with all the lines on them. Most of you won't know what all the lines are anyway. Just focus on where the two red arrows are and the olive green line heading down in the second graph.

The first red arrow indicates an extreme overvalued reading with stocks vs bonds. Big declines have occurred in the past when this condition has been present.

Second, the red arrow in the third graph indicates an overly bullish reading between small traders and advisors, also a bearish condition.

Third, the olive line in the second graph shows commercial selling beginning to come into the market place. Also a bearish sign when in a downtrend.

The short term trend is still up, but I am looking every day for my short term indicators to give me a sell signal. It will be all in on the short side when one shows up, and I am hoping for that this week. I am looking for a sharp decline here to start any day now.