GOLD
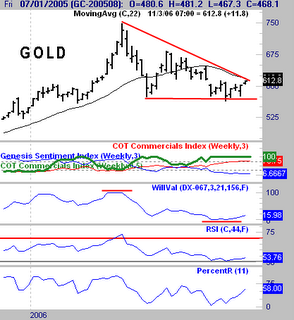
Here we now have a clearly defined triangle on a weekly GOLD chart. I have mentioned for a long time that 574.50 was a key level, and that any close below it would signal the end of the GOLD bull market. We have held that level so far and have bounced up right into the declining top of an obvious triangle formation.
Some gloom and doomers are calling for 35,000 or some such nonsense as the ultimate top of this market. (Just kidding about that number, but the predictions are ludicrous) It is also still undervalued against the dollar on a short term basis (the 3rd graph). If we get a breakout of this triangle on the upside on a CLOSING basis, this market can be traded from the long side on pullbacks.
Do not get tied into this inflated adjusted skit that people talk about who do not trade, as a basis for comparing these levels to historical levels. This is then used to extrapolate prices well into the thousands for target prices. Traders trade on the prices that are here, absolute levels. Economists talk about these other things, while being wrong time and time again in their predictions. Although you might want to keep that rap in your repertoire for cocktail parties and the beautiful women you might want to impress.
No comments:
Post a Comment