S&P 500
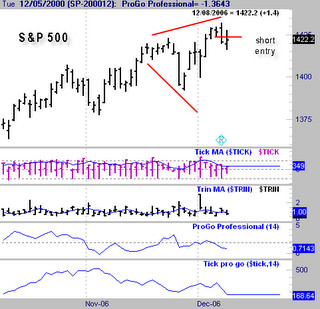
Here is a chart that displays the short term entry point, for anyone trading the broadening pattern in the S&P 500 I mentioned this past week. Once the pattern is formed, you short at the first break of a prior days low, with a stop above the high.
This is a noisy pattern, but the wins when they come are often very big. The win/loss percentage is low on this pattern, probably about 50%. When they occur at an extreme like this, in theory they should be a little more reliable, but I am not sure if that is true or not. I have not as yet been able to program this pattern, to fully test it. This is due to the almost countless variations that could be in place, that would qualify for the setup. It is much easier to visually identify it.
In any event, you will often be fighting big trends when entering these trades. Just study them on your own to see if they are of any use to you. They can be traded on all time frames, from a 5 minute chart up.
No comments:
Post a Comment