WHAT'S UP WITH BONDS?
My good old friend Treasury Bonds. I used the trade this market almost exclusively as I have chronicled in here in the past. This was before the electronic markets essentially invalidated the pit sessions. Many of my models were based on pit only data, and were ruined by the advent of the electronic sessions overnight. All of the sudden we just had a preponderence of gap opens that did not follow the old road maps of how gap opens typically acted.
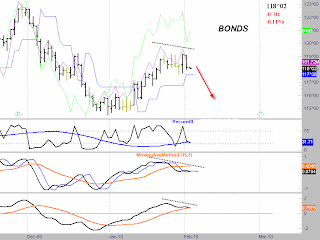
As you can see this market is somewhat of a mirror image of the stock market, and has had a flight to quality move here in tandem with the stock market decline. As you can see the strength in the market has not been confirmed by the oscillators here. We are also into a weekly sell spot which I will show below. As a result, it is time to look for a short entry here right now. I have also highlighted a divergence in one of the accumulation oscillators. This particular measure does not diverge too often, so I always listen when it does.
If we couple this with what appears to be a very short term rally in stocks beginning now, that should create a downward move here if it happens. There are a couple of flies in the ointment, in particular the commercials have been buying this market recently. I wish that were not in place, but we rarely have everything perfect. This is not a perfect world and trading rarely delivers perfection. There is enough here to take this trade. If it loses, guess what, some trades lose!
Here is the weekly chart showing the retracement to the lines I have discussed previously. Again, I will not reveal exactly what they are, but you can tell from a cursory glance that reactions to them are generally good entry spots.
One other thing to note is the strong seasonal tendency for a decline at this time which I have highlighted at the bottom with an arrow.
Good trading to everyone on Tuesday


No comments:
Post a Comment