TO BE OR NOT TO BE
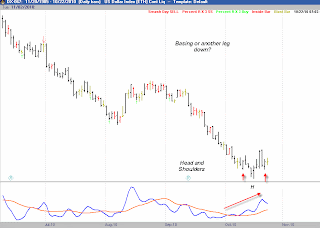
Here is how the Dollar Index looks right now. The magic question of course is, are we making a low or just hesitating before another leg down? By the book from a technical standpoint with my short term oscillator above, we are potentially making a low. If today were to close down, a buy signal for Monday would be in place. You can see the nice symmetry on the short term reverse head and shoulders here that I have marked on the screen. If we combine that with the oscillator being in an uptrend, it says buy.
Just thinking out loud here with a random opinion that I will not trade off, here is what bothers me about this. For a significant low to form here, we need a decline in the stock market to also happen. With the PPT the most active it has been in history, we really have to ask ourselves how likely that is? They have openly stated their goal is to inflate asset prices, and will use all the tools at their disposal to accomplish this. If we combine that with the strong seasonal time window we are in now, it does not seem too likely too me that a major top is forming in stocks. This feels like the 90's again all of the sudden. Since these two, stocks and the dollar are trading at a close to 100% inverse correlation right now, it seems highly unlikely the dollar could rally and stocks would not decline. This trade then becomes by default a bet against the stock market.
I will still take this trade because I do not trade based on opinions such as what I just discussed, but I do not have high hopes on this one. However, maybe my opinion on stocks is wrong, which again is why trading on opinions is so difficult. How do you know which ones are right or wrong? We also have alot of commodities looking a little top heavy to me here, which does support a rally in the dollar. The next chart is the SP 500, which in my mind just does not have a clear trade in either direction. We have a tight narrow band in the timing indicator while price moves steadily higher. This is not really a divergence, or a gangbusters uptrend to support the move, hence it is no trade for me. I want my trades to jump off the page as being obviously one of my patterns, and this as much as I am trying to force one, just does not meet that criteria.
I wish this had more clarity for me but it does kind of make sense that it does not since this whole move is being escalated by a narrow group of people in power. Prices are not rising for the traditional reasons so why would the indicators line up? The whole thing makes no sense.


No comments:
Post a Comment