SELL IN MAY AND GO AWAY?
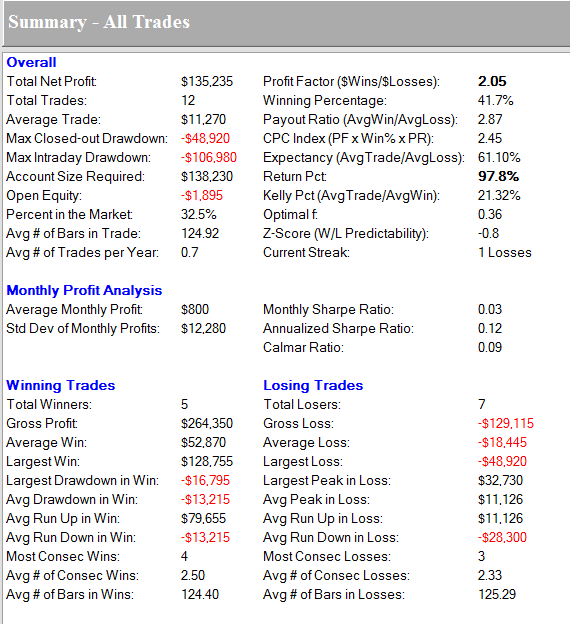
These are the results if you shorted the S & P 500 Big Contract on the first trading day of may and exited on the 20th trading day of October every year since 1995. I chose the 20th day of October since I know that is the optimal time to go long for the year end rally that happens with such high probability.
At first most people would look at the win % of 42% and kick this to the curb instantly, not me. For something to be right only 42% of the time and make this much money, there has to be something going on that is worth checking into. One thing I got out of the trip to Chicago that was completely unexpected, was a different view on systematic trading. Tim Rea the winner of the Robbins contest last year has a surprisingly low percentage of winners with his systems. I will not reveal what it is, but suffice it to say that it is not what most people would expect. I suspect this is why he does so well. He knows that over time the big wins overcome the small losses. He is one of the world's top traders, so I think that is a lesson we all can learn from. Perfection is what we all strive for, yet it is rarely attained. Further, the attainment of it is not necessary to trade profitably. The key to doing well trading is catching big moves. If all you do is scalp out little gains over and over, you just have so much pressure to have a very high winning percentage that ultimately you blow up.
There is a troll who surfs the internet who claims he has a 40% per year annual return doing what is basically arbitrage. He claims to be able to scalp and make that type of money. Of course he is looking for money so obviously he is not making any. Some liars just aren't very smart with their lies. I went back and forth with this clown through emails for about a week before kicking him to the curb. I finally realized he was just completely lying about everything. I suspected he was but thought it was worth checking out just in case. In that type of strategy you have to almost never lose because you make so little on the winners, that one loss wipes out a whole series of them in the equity column.
What we have above is a good dollars won to dollars lost ratio, which is a good start. To me that tells me this is something to look further into.

Skipping forward to wait until the first trading day of July to sell things look better. Our accuracy goes up quite a bit. However, notice the money made is much much less. What this tells us is that we probably are typically getting some choppy price action at the top and the rollover starts a bit later, about July. These statistics are not anything that you can trade with, they just give you a bias of where to look.

Here we are skipping forward to August, selling on the first day of that month. Our profits kick back up quite a bit here and the profit factor jumps up as well. The next summary is very interesting to me, selling the first day of September.

This is surprising, but the numbers speak for themselves. It is a very poor strategy on average to look for large September swoons even though I think a lot of people have it in their mind that big drops have occurred at that time.
In summary, by the numbers, May, July, and August are the best times to exit the market or go short, with the idea of getting back on the long side in late October. Most people understand that you need a bit more to take a trade than just something as simple as this above example. However, this does give you an idea of when the big moves down have occurred on average. We know we need to catch the big ones, so it is time to look for the big ones to be down. Once we get to the fall, that view will do a 180 and we will begin to look up.
Simple enough.
3 comments:
I wonder if this being an election year makes a difference. I think there's a statistic that June, July and August are pretty bullish during election years if you look at the stats from 1926?
have you added in being in an election year as a factor?
these numbers are just straight up they are just what happened without any opinions about anything being interjected into them. By and large election biases are in the same direction month to month as these stats show, so there would not be much of a difference if any had that been taken into account.
Post a Comment