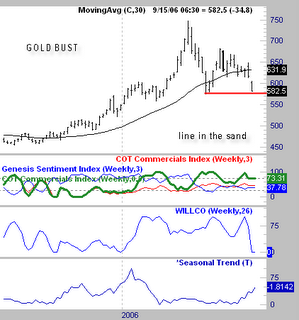
 Golds Moment of Truth
In May I posted current charts of Silver and also the Silver chart from the all time high and asked if anyone thought they looked familiar? They were identical (the correct answer).
Following up with this at a later date, I described a pattern with a large run up followed by a sharp drop, then a rally attempt that fails to make new highs. As "luck" would have it this is exactly what we have gotten. This is a GOLD chart not Silver, but the formation and concepts are the same. In this formation, the low of the sharp drop 574.50 becomes the key support point. This is marked by the red line on the chart.
When these support points get taken out generally a large drop follows. We are very close to that low being taken out here, and if it does get penetrated the game is over in this market. Keep in mind there are no absolutes in trading just tendencies that we need to be aware of to more effectively manage our risk.
For those of us who have watched these types of things painfully punish the chasers over the years, it is clear when people start talking about outlandish price levels like $1300, $1800, $2800 that the top is in. This has not been easy to short by any means and I have not done it. However, I have completely stayed away from the long side mostly due to this big picture pattern that has been forming. Had a strong short term buy pattern setup while the trend was still up, I would have taken it, but nothing did.
3 comments:
Lewis,
Yes the commercials have gotten heavily long with the COT index from genesis showing 100%. This just measures their positions relative to what they have been over x time periods. It does not mean that every one of them is long.
My feeling though is that it is not unusual in a down trending market for this to happen, and we are on the verge of any uptrend that could be drawn in breaking.
Both the chart pattern and the fundamentals have to line up to make the trades probabilities the best and the chart pattern is very negative right now. We had a gap down low close bar on the weekly which is not good.
The best way to use COT stuff is for entries in trends, ie if we had a strong uptrend and a pullback in price and the cot read like it does right now it would be a good buy setup. Unfortunately we do not have a big uptrend. I had been hoping for the trend to hold to set up a buy but it certainly looks like that 574.50 is not going to hold.
Lewis,
Look back to 1980 and you will see an eerily similar chart pattern on a weekly chart to what we have here. I think the result is going to be the same, but that is an opinion just based on the chart alone. If you also look at 1986 and 2000 you will also see similar chart patterns with the big run up, sharp drop then sideways to weak rally up. In one case the low held and pricec continued upward for awhile. In the other it broke and prices moved down for a long time.
This is why I have been saying for awhile now that this low of 574.50 must hold to save this market from a big long lasting downward move.
Lewis,
Sounds like you have a good handle on things. It will be interesting to see if that bounce in the commercials longs will generate a bounce. Often they are early. With the trend down, I am hoping they move to the short side on any bounce confirming the short entry.
Post a Comment