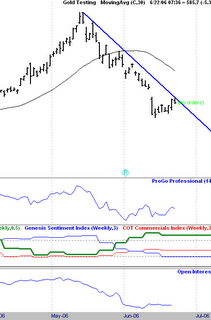
 Here is the Daily Gold chart as promised yesterday
The first thing to notice, is how different this is from the weekly chart. There is a well defined downtrend in place. This is no secret, as the price has dropped from a high of 725 to a low of 561. The overall hierarchy of trading dictates that the larger time frame chart (weekly) should take precedence over the shorter (daily).
What this means is that we should take the larger term uptrend from the weekly, and try and time an entry in sync with the trend on that chart, on the shorter term daily chart. This is easy, when both of them have the same trend. When, they each have different trends, like this it becomes more of a challenge.
You can always choose the catch the falling knife in this situation, and hope the larger term time frame, does rule the day, and the price magically stops. I prefer to wait until there is confirmation that the drop has stalled. This at times will result, in buying at a higher price. It will also result at times, in dodging a major collapse.
Of course, dodging the major collapse, is the basic reason why this is prudent. I do not mind buying at a higher price, if I can sell at a higher price. The gap on the chart, which is just above where the price is currently trading, is the first level that must be exceeded. We have partially filled it so far, but often there is much overhead resistance in these gap areas. If you were just looking at the daily chart alone, this would simply be a bear flag selling setup into a gap. In general, those are decent setups to short a market.
Many discretionary traders I know, trade just these setups alone, claiming they are the holy grail. I would not go that far, but retracements in a trend are overall a profitable way to trade. Ideally, what we will get is a break of this daily downtrend. This would have both time frames both daily and weekly together. Then, wait for the first pullback in the daily uptrend. Once that occurs, play the retracements down against the new uptrend. This is the highest probability way of trading the market here.
If that does not develop, stay clear. There is the possibility price could continue lower here. The chart pattern, does have an eerily similar look to the 1980's top.
No comments:
Post a Comment