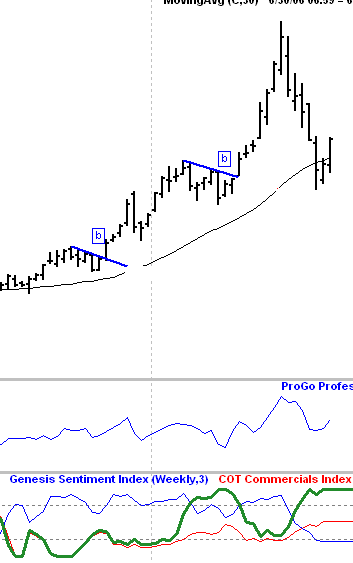
 This chart is posted for you Lisa, but may be of value to others as well. This is a weekly Comex Gold chart, with 2 "bull flags" marked. This is an age old technique for buying pullbacks in an uptrend. What you do is basically wait for a pause in the action, that visually looks like a flag. The blue lines, mark the top of the flags. Basically, you wait for a breakout above the flag (blue line), to enter a postion, in sync with the underlying trend.
This GOLD chart provided 2 very nice such entries this year. Notice, how the most recent drop from the high, never broke out above any flag line that you would draw. Waiting for this breakout, saves you from blindly catching a falling knife, like what we have had recently.
Notice, the difference just in simple terms, for how the more recent pattern looks, compared to the prior two. The best flags setup, look like the first two. This is a very low risk way to trade trending markets. The trades can last anywhere from a week to a month or two, depending on how you manage them.
There was a time, when I traded only this pattern, many years ago. I just went to the markets, whatever it was from Oil to Corn, to bonds, looking for this pattern. When I saw it, I just played it. It is a profitabe approach to trading, in general.
Trends only go on for so long, so the flags that setup later in the trends are higher risk. This trend has been in place for awhile in this market. Low and behold, you get a nasty pullback, like what we have had recently.
3 comments:
Chris,
You had mentioned in an earlier post that a fill to 608 might start a rally in Gold. I think gold crossed 608 on Friday. Do you think the market is bullish now or is there any other indication that we need to look at.
at 608, the downtrend broke. I did not catch this long move up off the lows unfortunately. I would suggest looking for pullbacks against the trend. I did have a separate post on this.
kp, to expand on my last answer. The commercials are still long, and the downtrend is broken. So yes, the signs point up. If the 561.50 low gets taken out this whole market is DONE. That would mark a large scale pattern failure that could lead to a huge selloff.
Until that happens, and as long as the commercials are long, this is a market to play from the long side.
Post a Comment