 BONDS
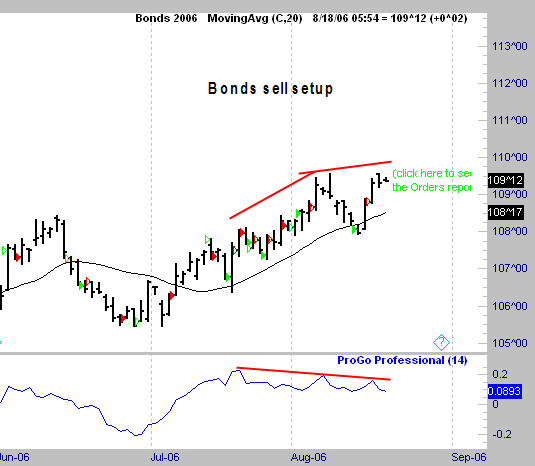
BONDSHere we see the 30 yr bond chart. We have had a nice rally off the lows and have broken the strong downtrend on the daily charts. Monthly charts still show a downtrend in place.
Notice how we have the ProGo indicator showing a divergence against this upmove. We have 3 higher highs in price with 3 lower peaks in the indicator. These 3 point divergences speak loudly that the insiders are not buying heavily into this upmove. The COT report comes out today, so we will see if the commercials are moving out of this market. As of last week they were reducing long positions.
The daily trading service does have a sell signal for today that has not been filled yet as I write this. It is NOT based on this graph. The daily service is a completely mechanical system and this type of visual is not programmable. However, I do like to see this type of thing backing a mechanical signal to take action. It combines a little art with alot of science.
No comments:
Post a Comment