 T BONDS
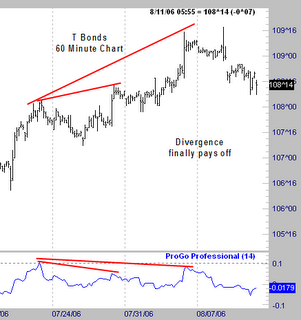
The bearish divergence that I pointed out in T Bonds last week has finally resulted in a price drop.
I mentioned that these can go on for awhile before anything happens and that is exactly what occurred. This is case in point about why you should not just blindly fade a market move just based on an "indicator" reading. This may not seem like it took that long in days, but if someone is trading a 60 minute chart, this is an eternity. The divergence first showed up at the end of last month.
To sit in a trade for two weeks that is based on a 60 minute chart pattern would rank as a poor trade in terms of timing. The whole point of using a 60 minute chart is to dial in the timing of a higher time frame setup
Thankfully, Paul McCulley from PIMCO said don't short bonds right at the high. So I shorted them. ( Just a wise crack - I did not short term due to his comments ) As a result the shorts did pay off from up there. Of course, his comments were based on a higher time frame than this. I doubt he cares about a one basis point move.
However, as a short term traders, that is $1000/contract or the equivalent of a $10 move in Gold. This is more than enough movement for us to profit from.
No comments:
Post a Comment